Central Africa
Central Africa
The IPCC’s Sixth Assessment Report: What’s in it for Central Africa?
This factsheet highlights:
- How Central Africa’s climate is already changing
- Central Africa’s future climate
- Climate change impacts we have already seen in Central Africa
- Future climate risks in Central Africa
- Central Africa’s potential to adapt
- Key investment areas for a climate-resilient Central Africa
Explore the factsheet, along with free-to-use images and infographics, below.
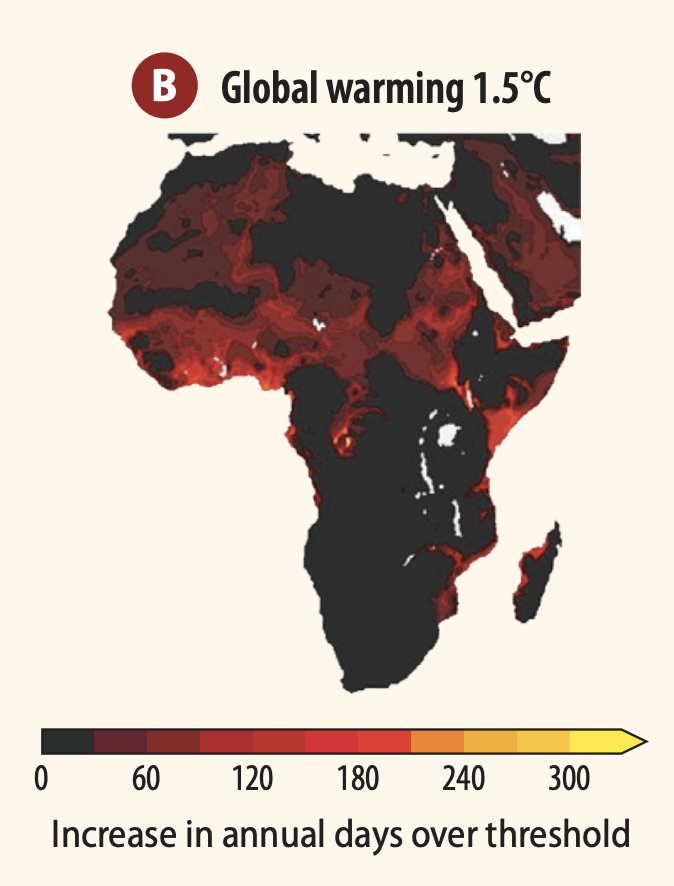
Increase in the number of days per year with severe heat stress for global warming of 1.5°C above pre-industrial levels (1850–2100)
Courtesy of CDKN

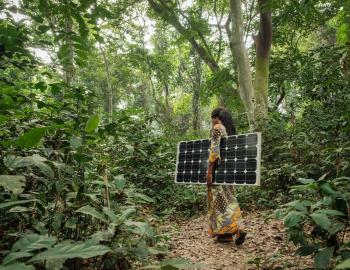
Graphic map of Central Africa.
Climate change is already challenging the health and wellbeing of African communities, compounding the effects of underlying inequalities (high confidence).
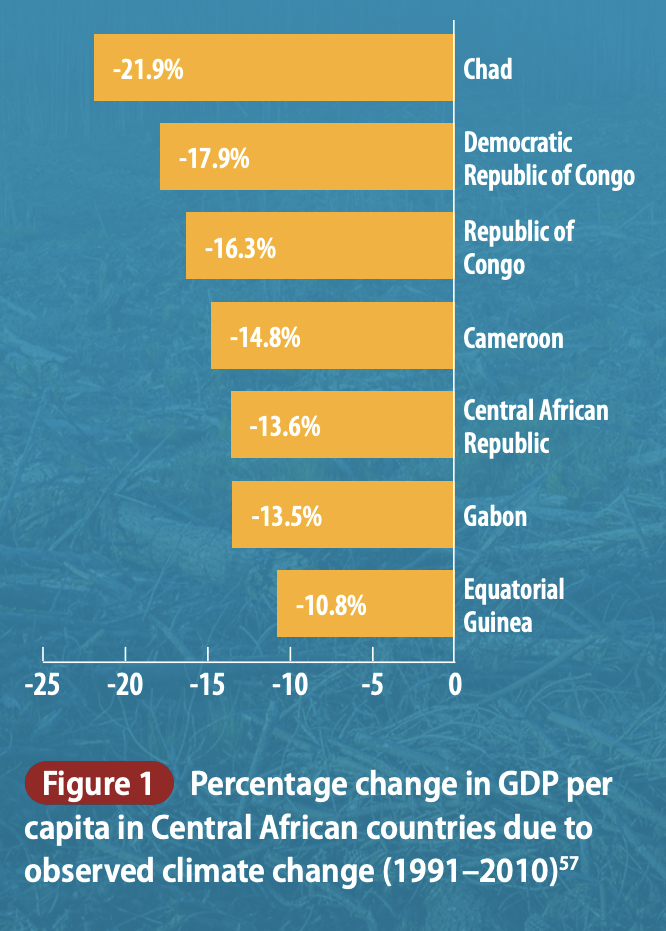
In one estimate, African countries’ GDP per capita was on average 13.6% lower
over the period 1991–2010 compared to if human-induced climate change had not occurred.
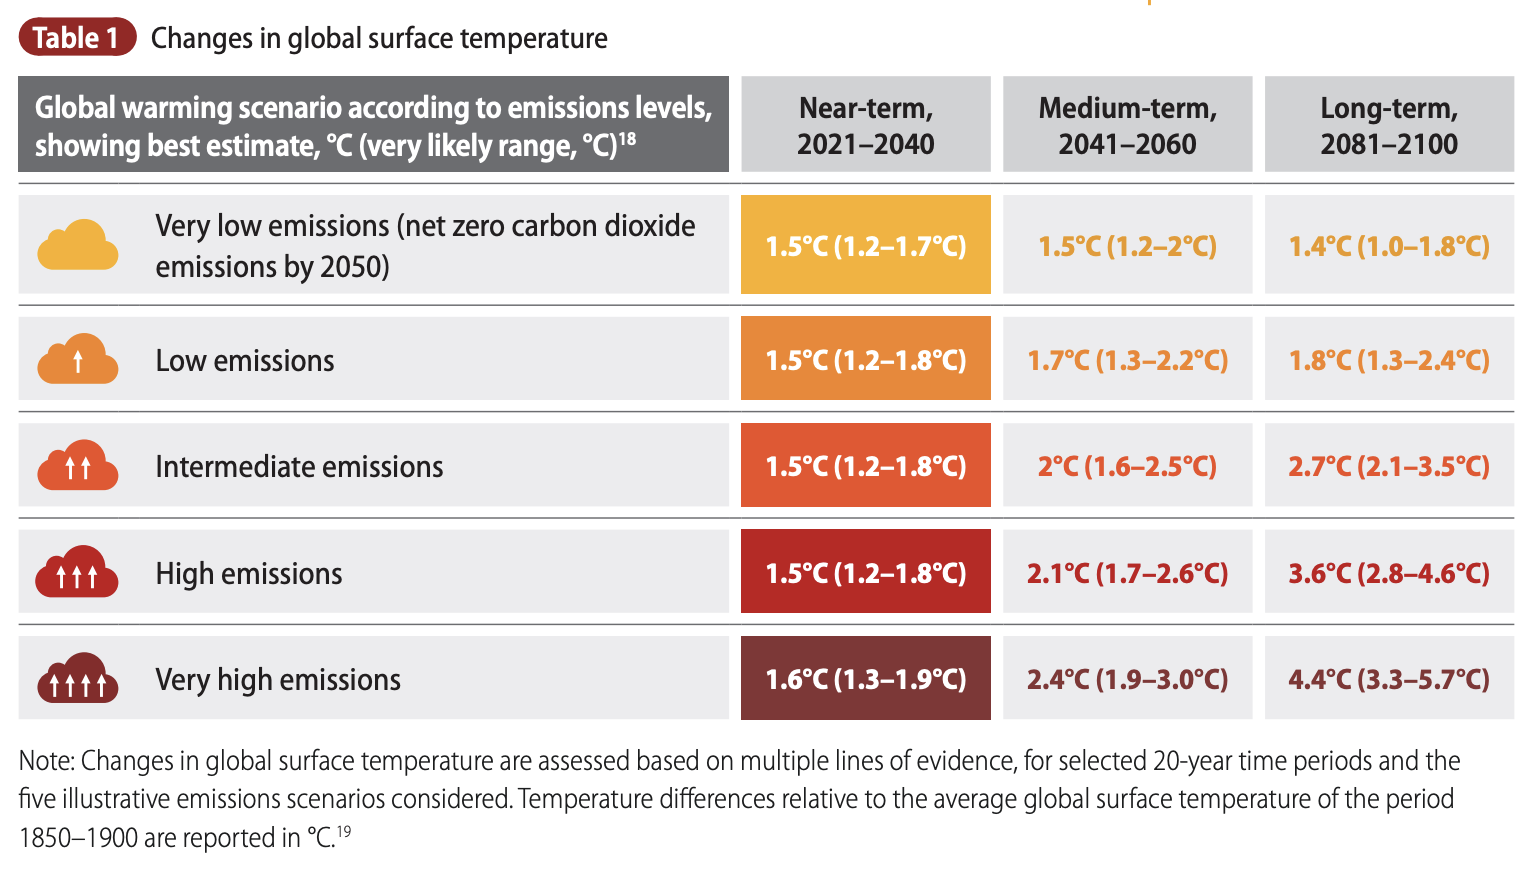
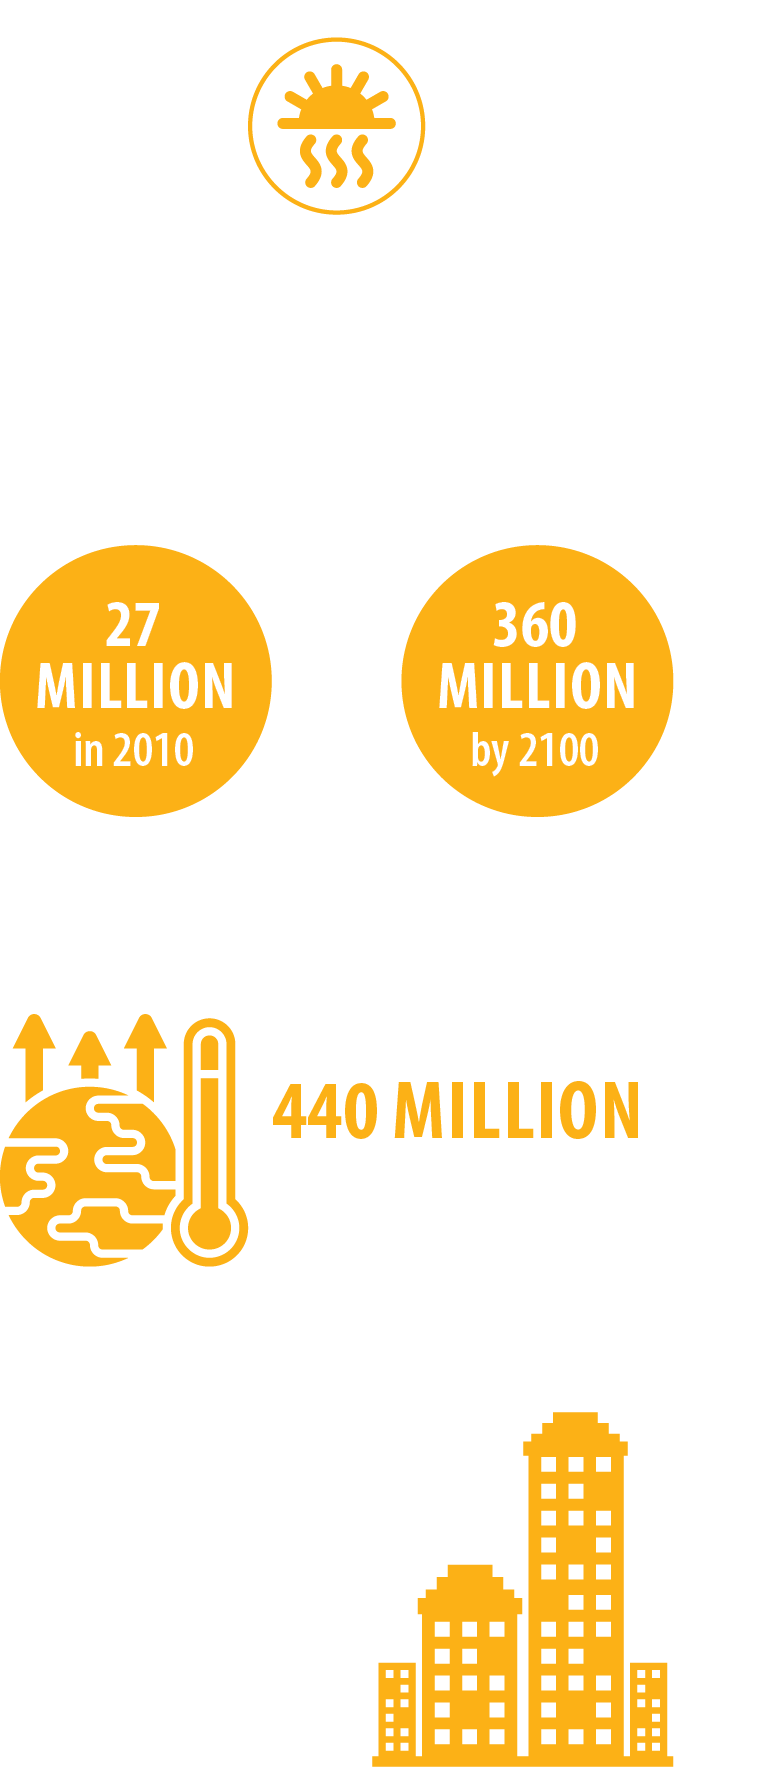
The Earth’s average surface temperature is expected to reach or surpass 1.5°C of warming above preindustrial times (1850–1900) in the near term (up to 2040), according to the IPCC’s most recent assessment.
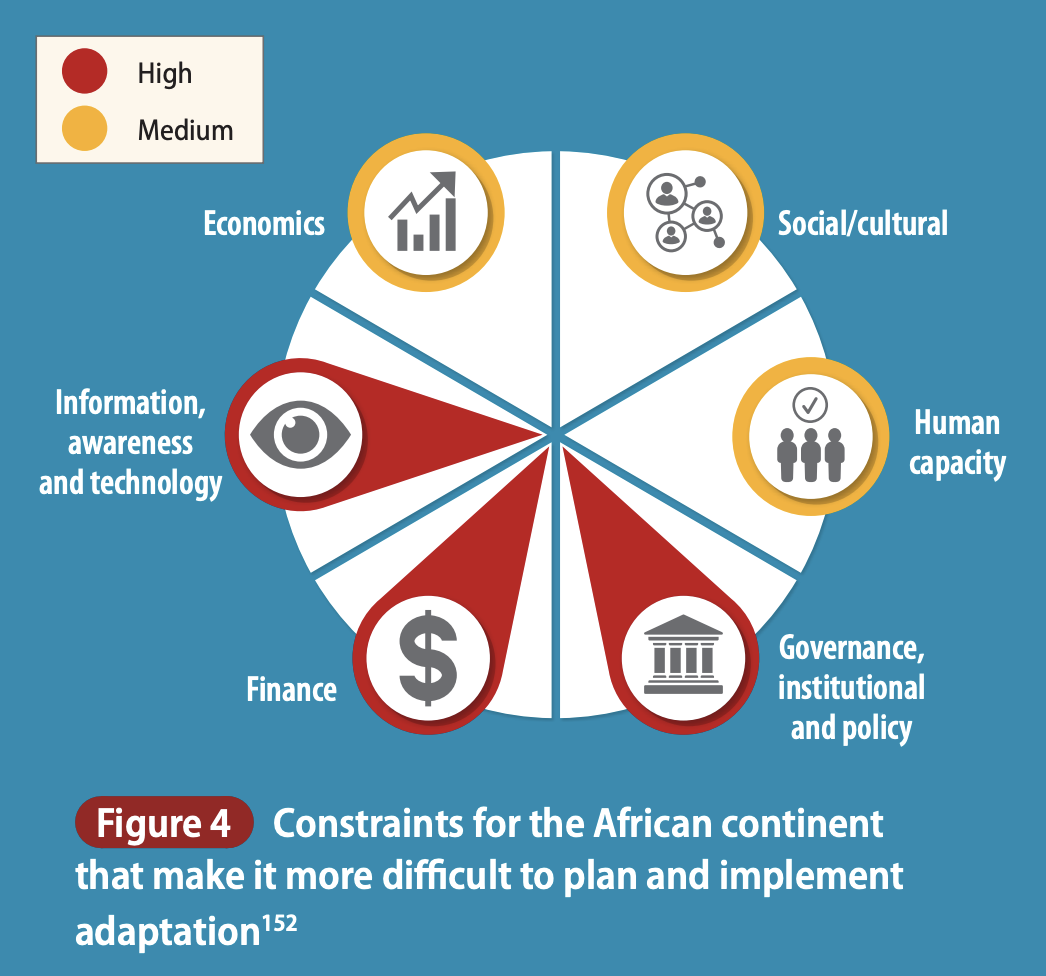
The ability of southern African communities and sectors to pursue effective adaptation options to the full is constrained by lack of finance.
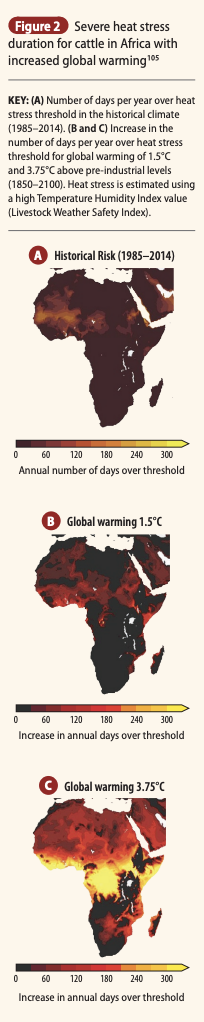
KEY: (A) Number of days per year with severe heat stress in the historical climate (1985–2014). (B and C) Increase in the number of days per year with severe heat stress for global warming of 1.5°C and 3.75°C above pre-industrial levels (1850–2100). Heat stress is estimated using a high Temperature Humidity Index value (Livestock Weather Safety Index).
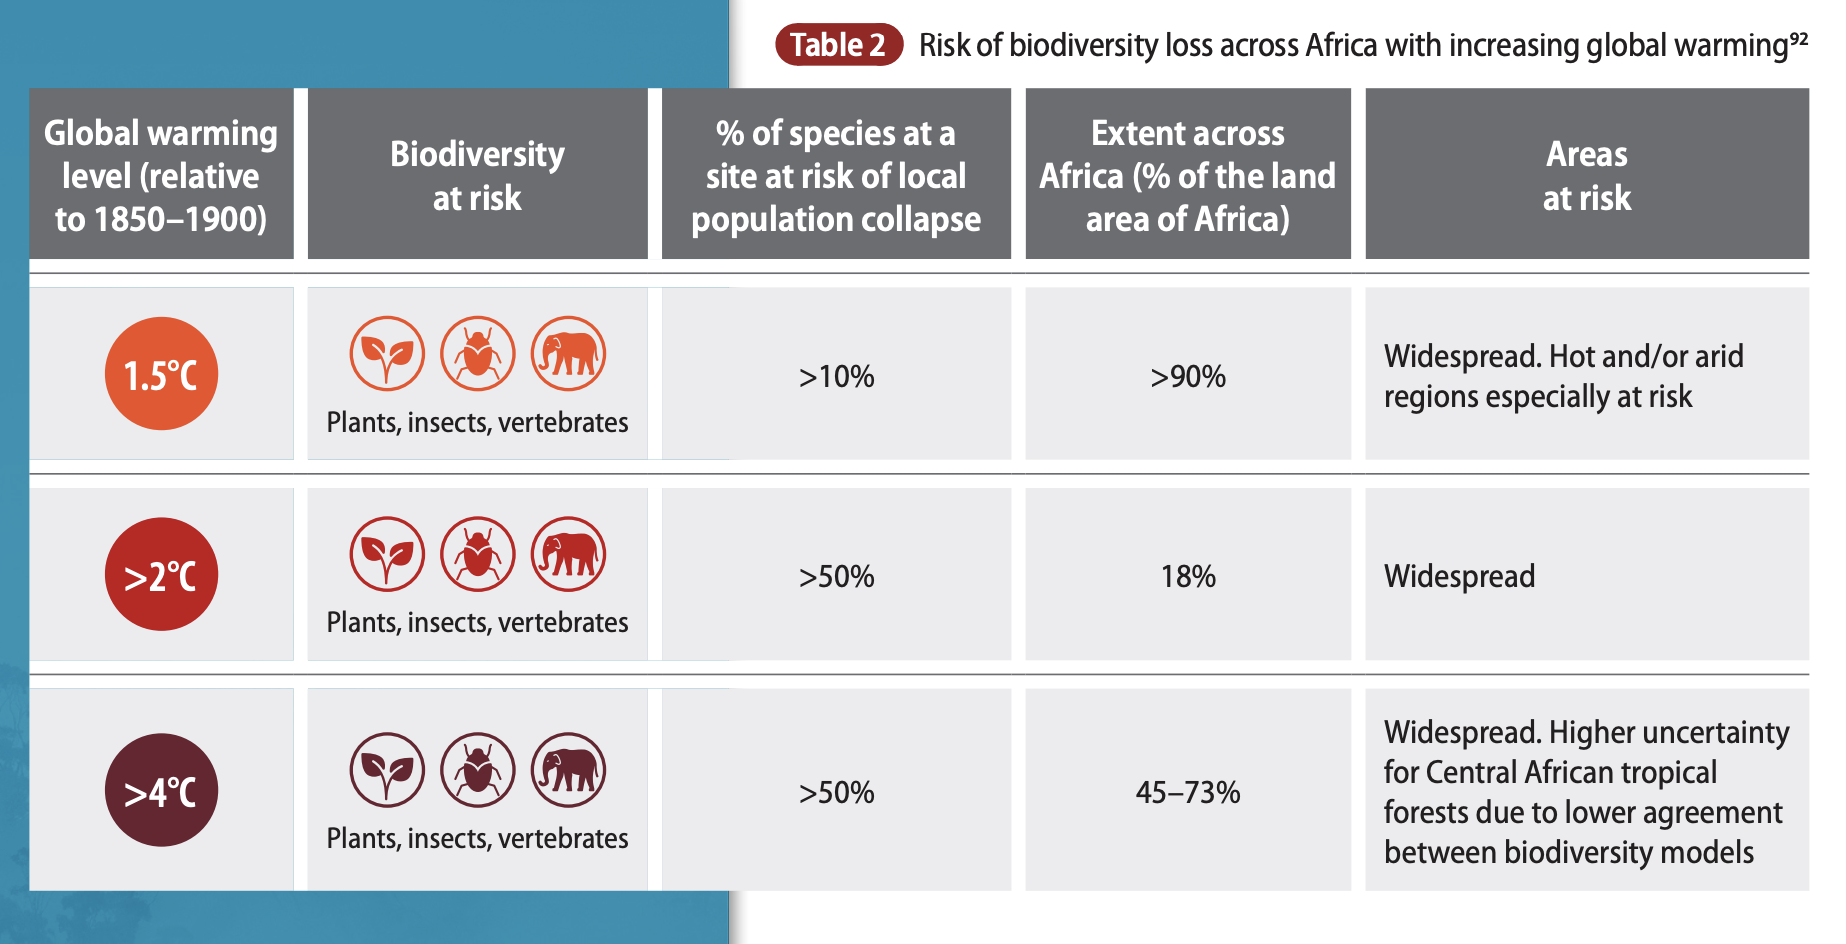
With every increment of global warming, the risk of biodiversity loss and species’ extinction increases across Africa.