Central Africa
Central Africa
The IPCC’s Sixth Assessment Report: What’s in it for Central Africa?
This factsheet highlights:
- How Central Africa’s climate is already changing
- Central Africa’s future climate
- Climate change impacts we have already seen in Central Africa
- Future climate risks in Central Africa
- Central Africa’s potential to adapt
- Key investment areas for a climate-resilient Central Africa
Explore the factsheet, along with free-to-use images and infographics, below.
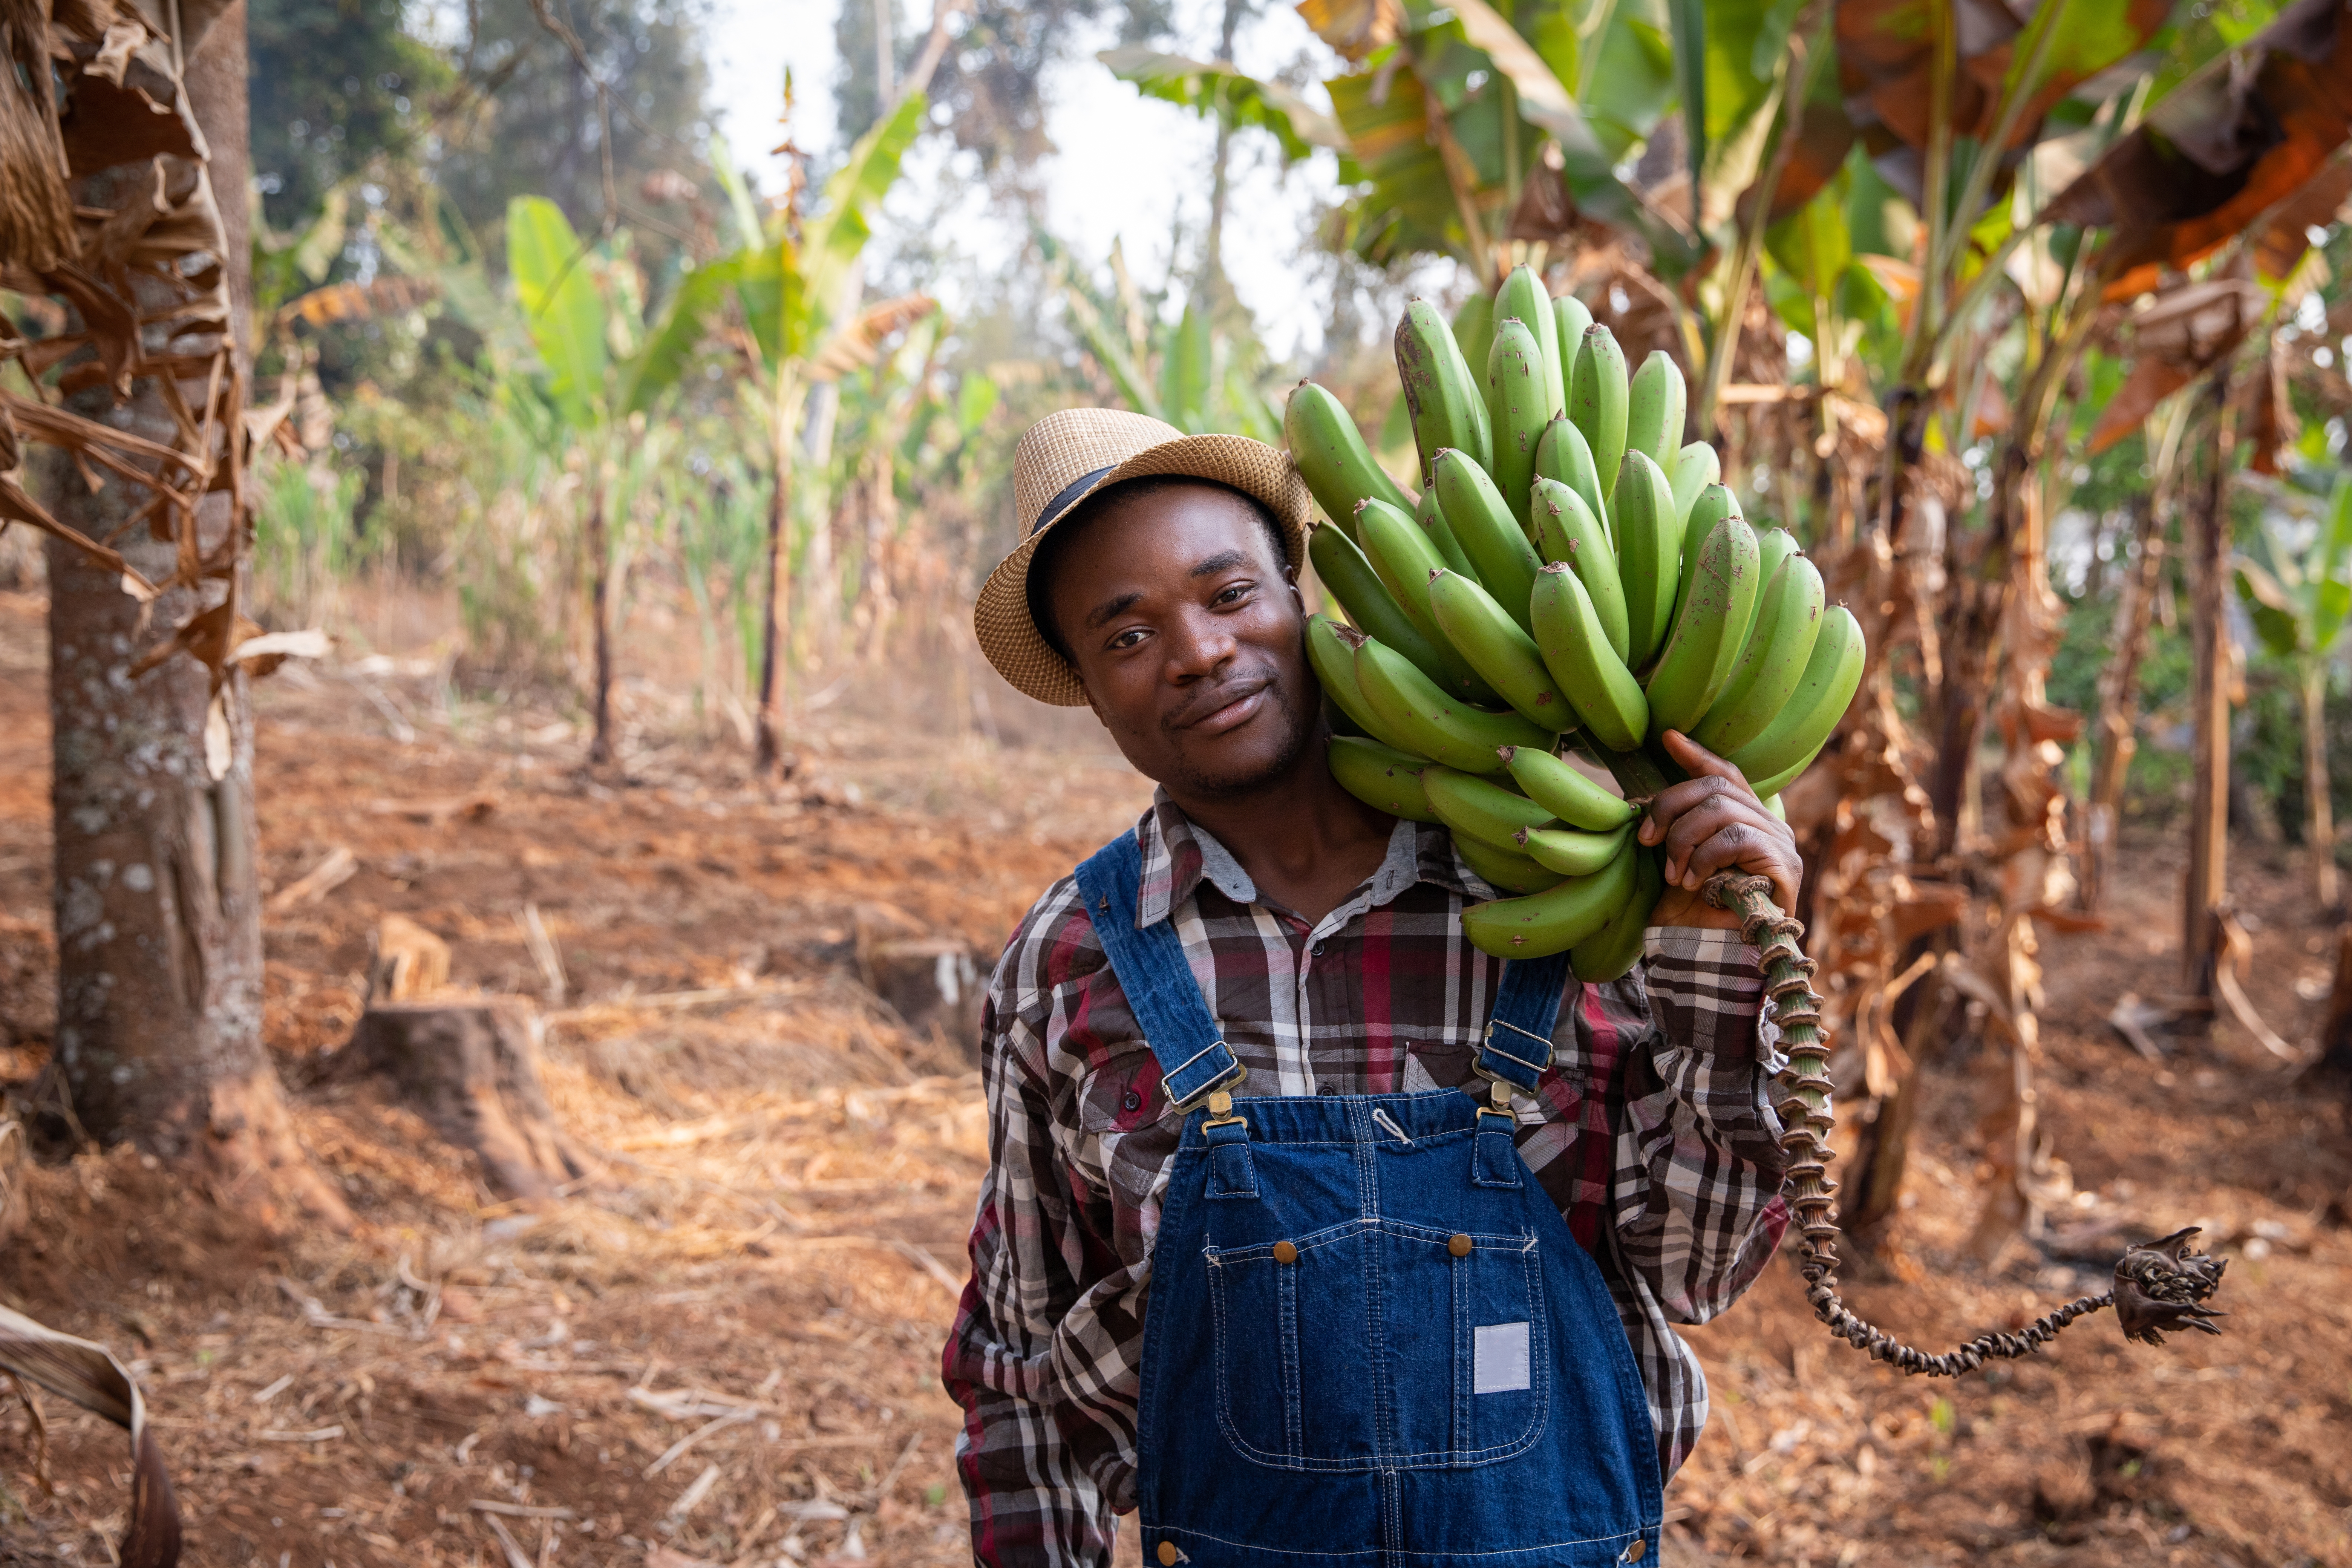
Image of a plantain farmer, Cameroon.
Courtesy of Media Lens King via Shutterstock
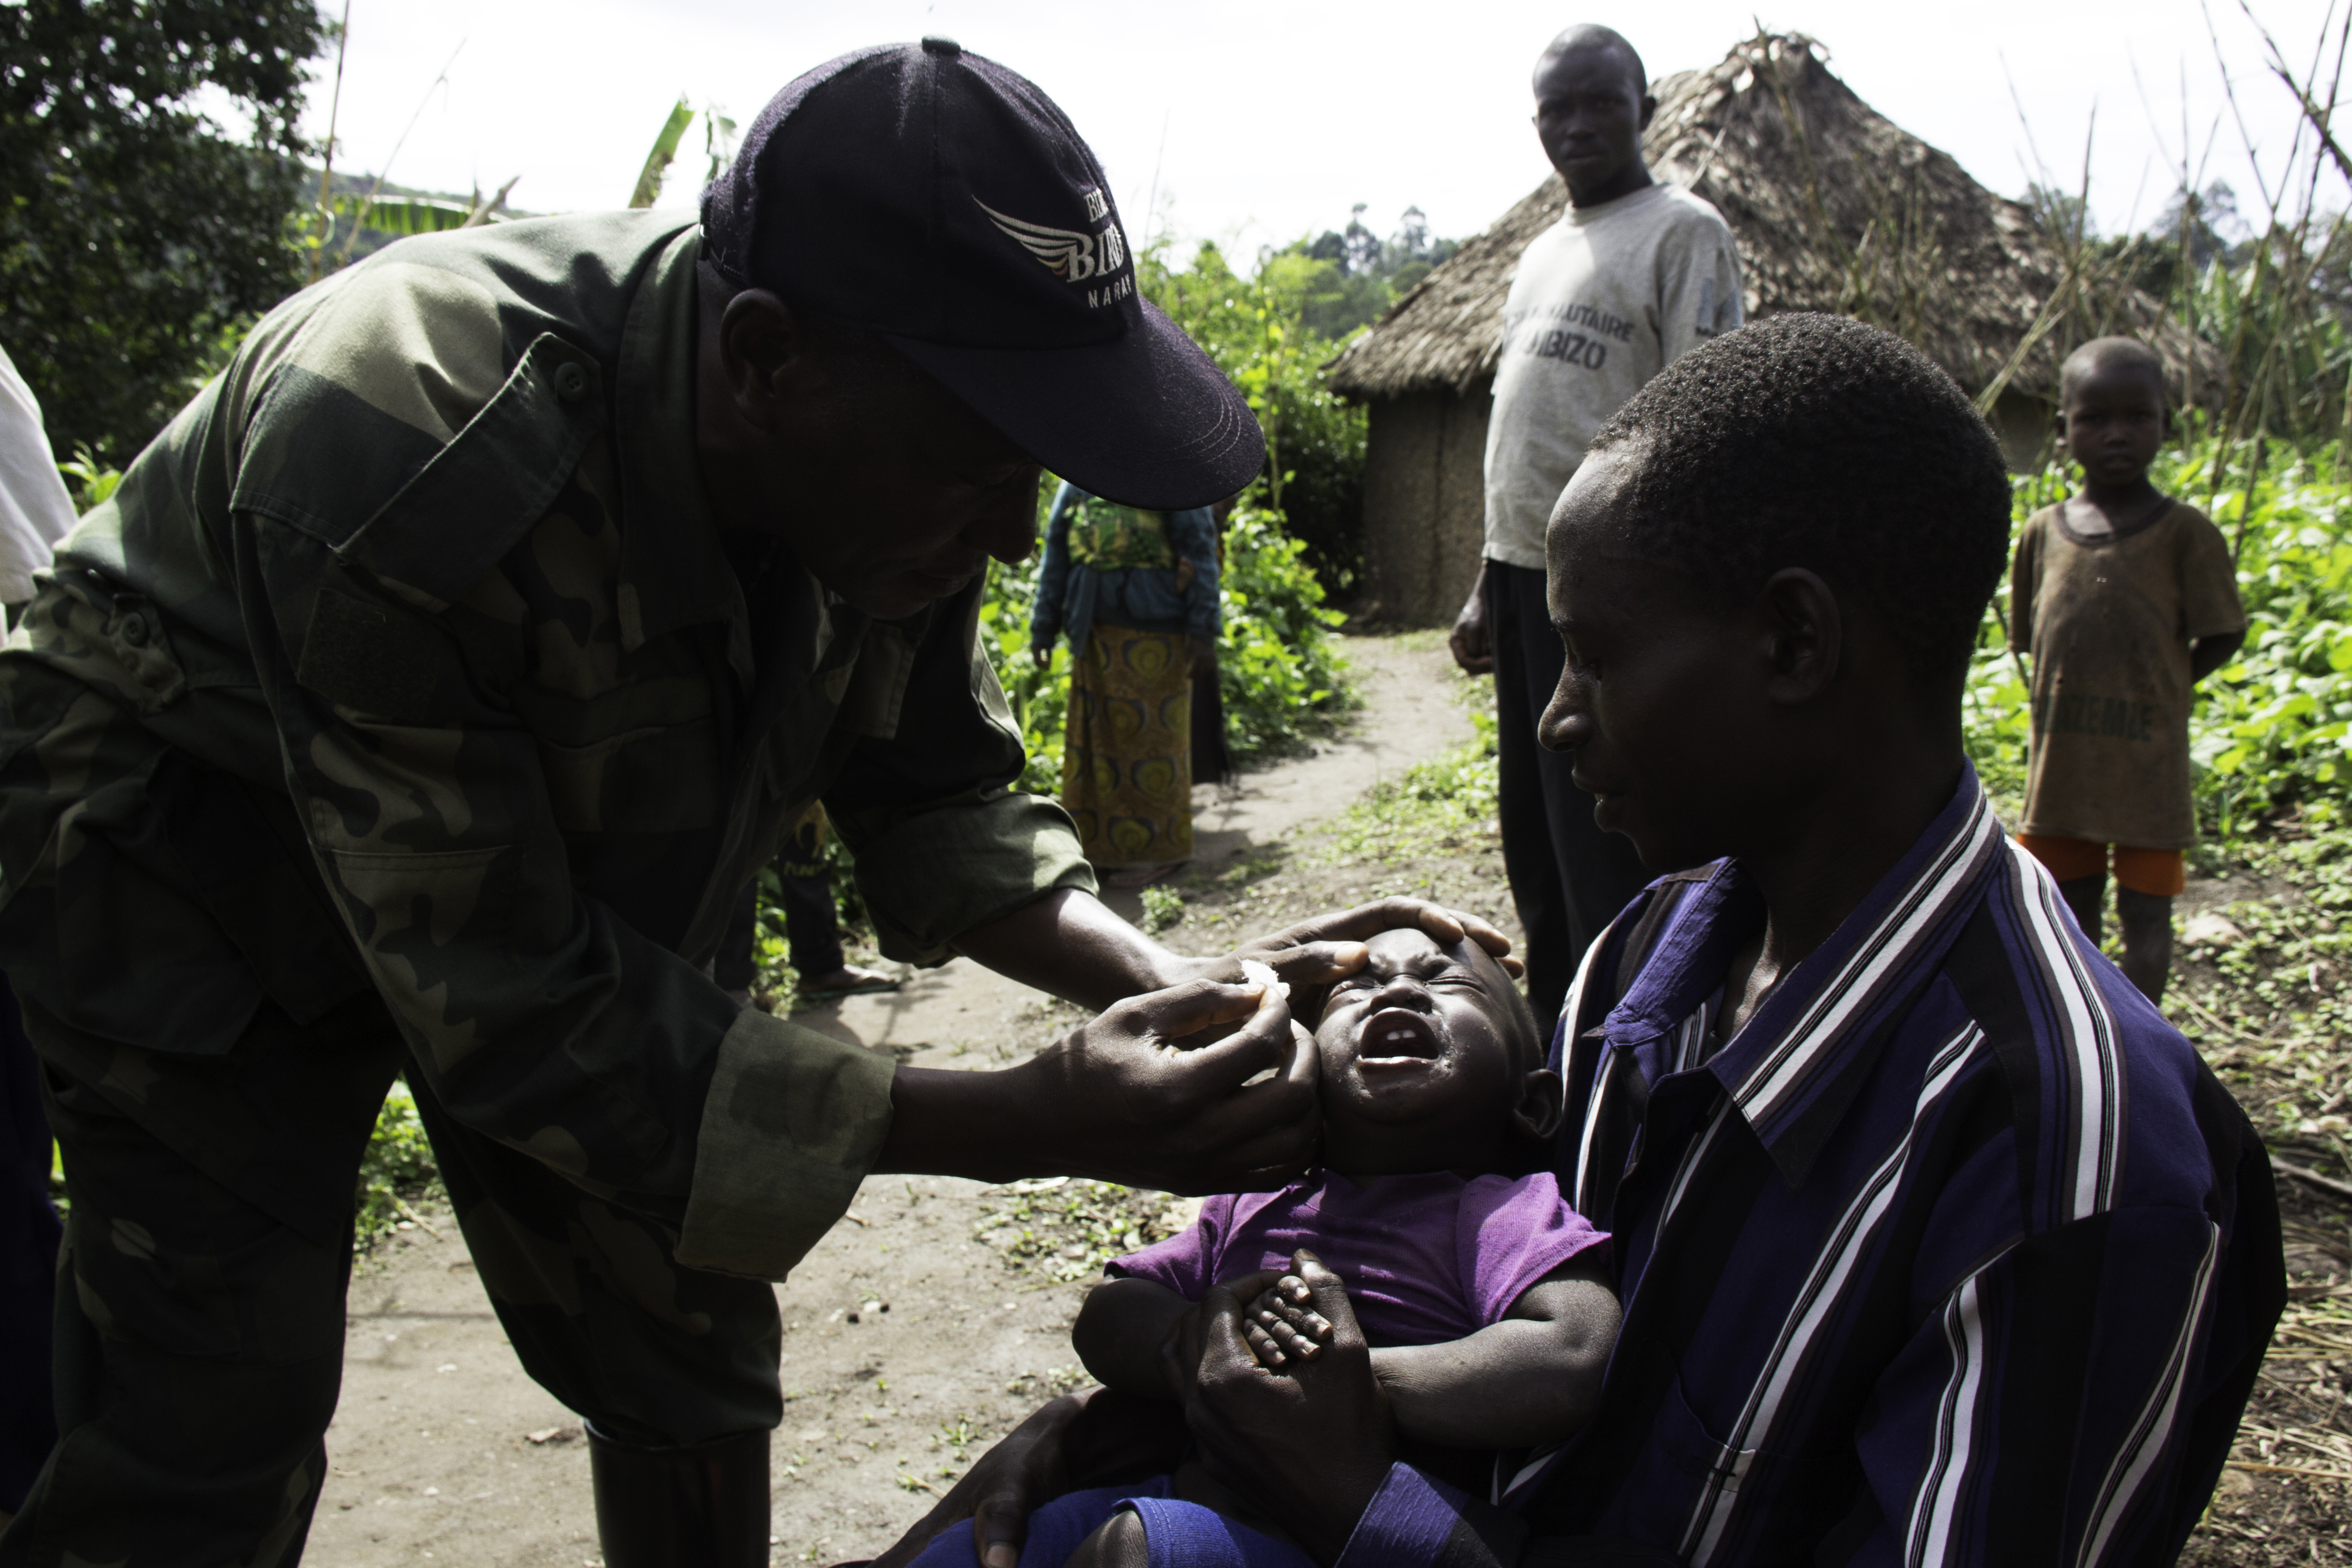
Image of child receiving medical care in Chai, North Kivu in the Democratic Republic of Congo.
Courtesy of Jon_Brown via iStock
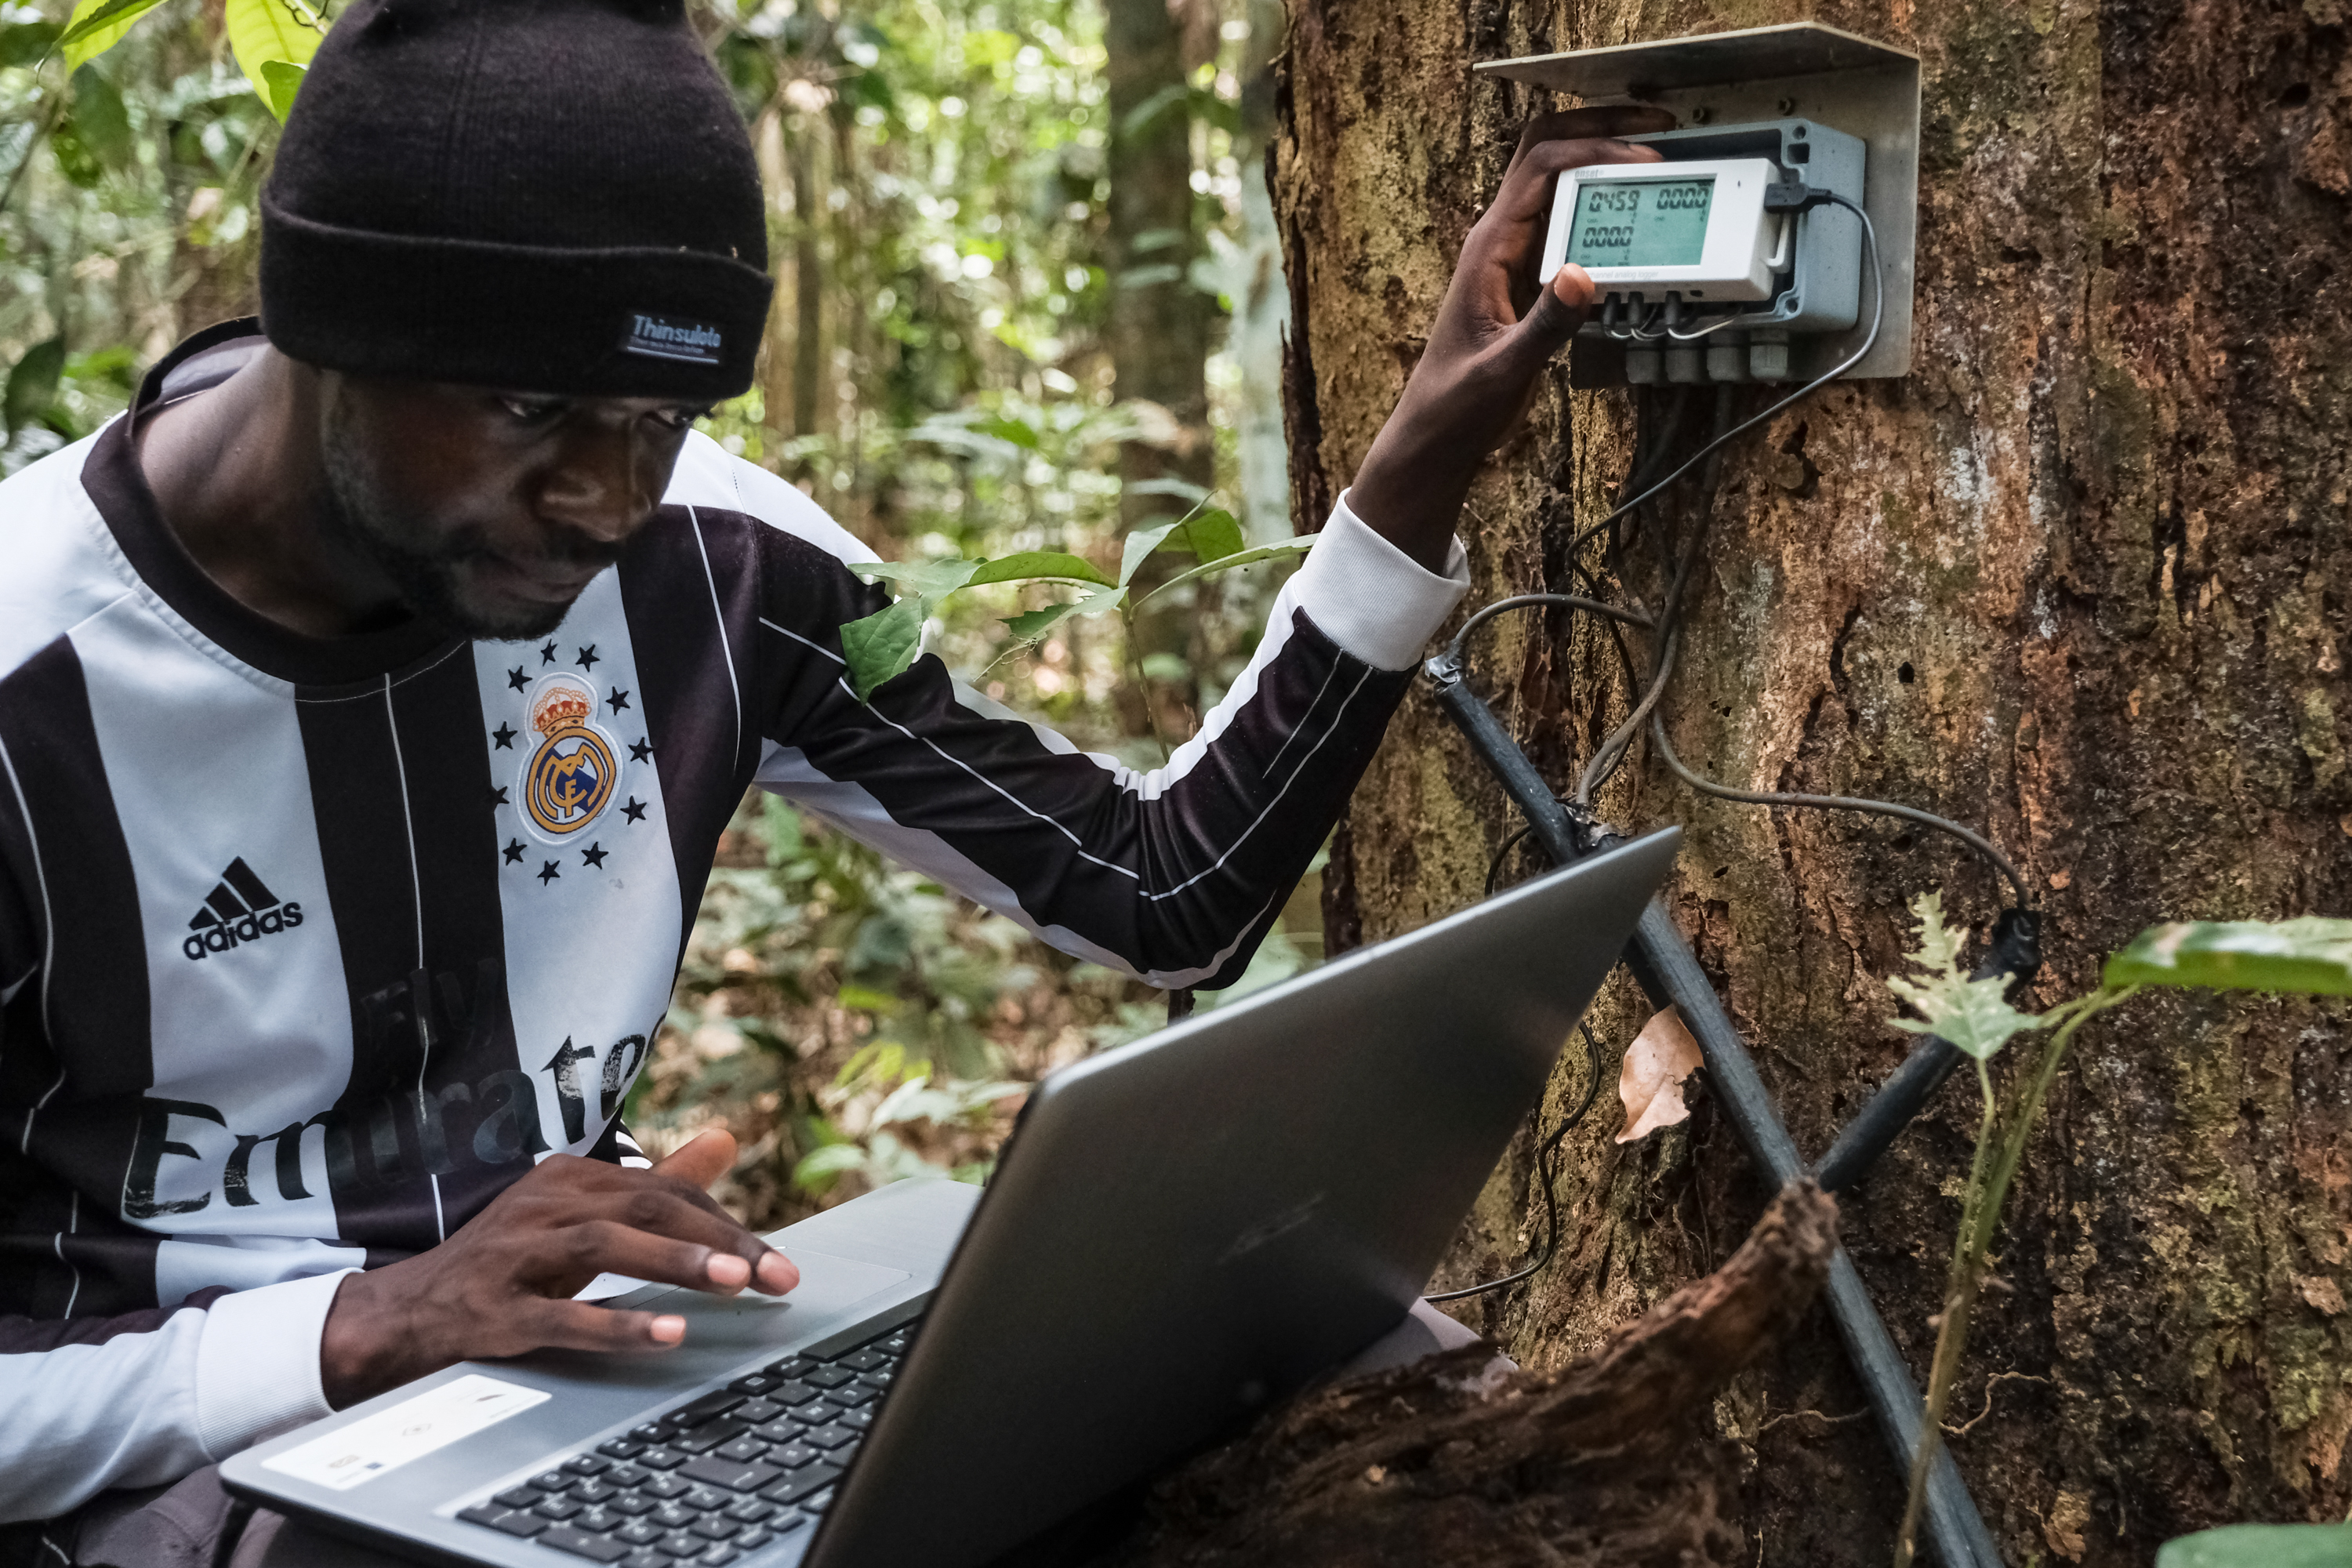
Image of forest monitoring in Yangambi, Democratic Republic of Congo.
Courtesy of Axel Fassio/CIFOR via Flickr

Image of children carrying water near Yangambi, Democratic Republic of Congo.
Courtesy of Axel Fassio/CIFOR
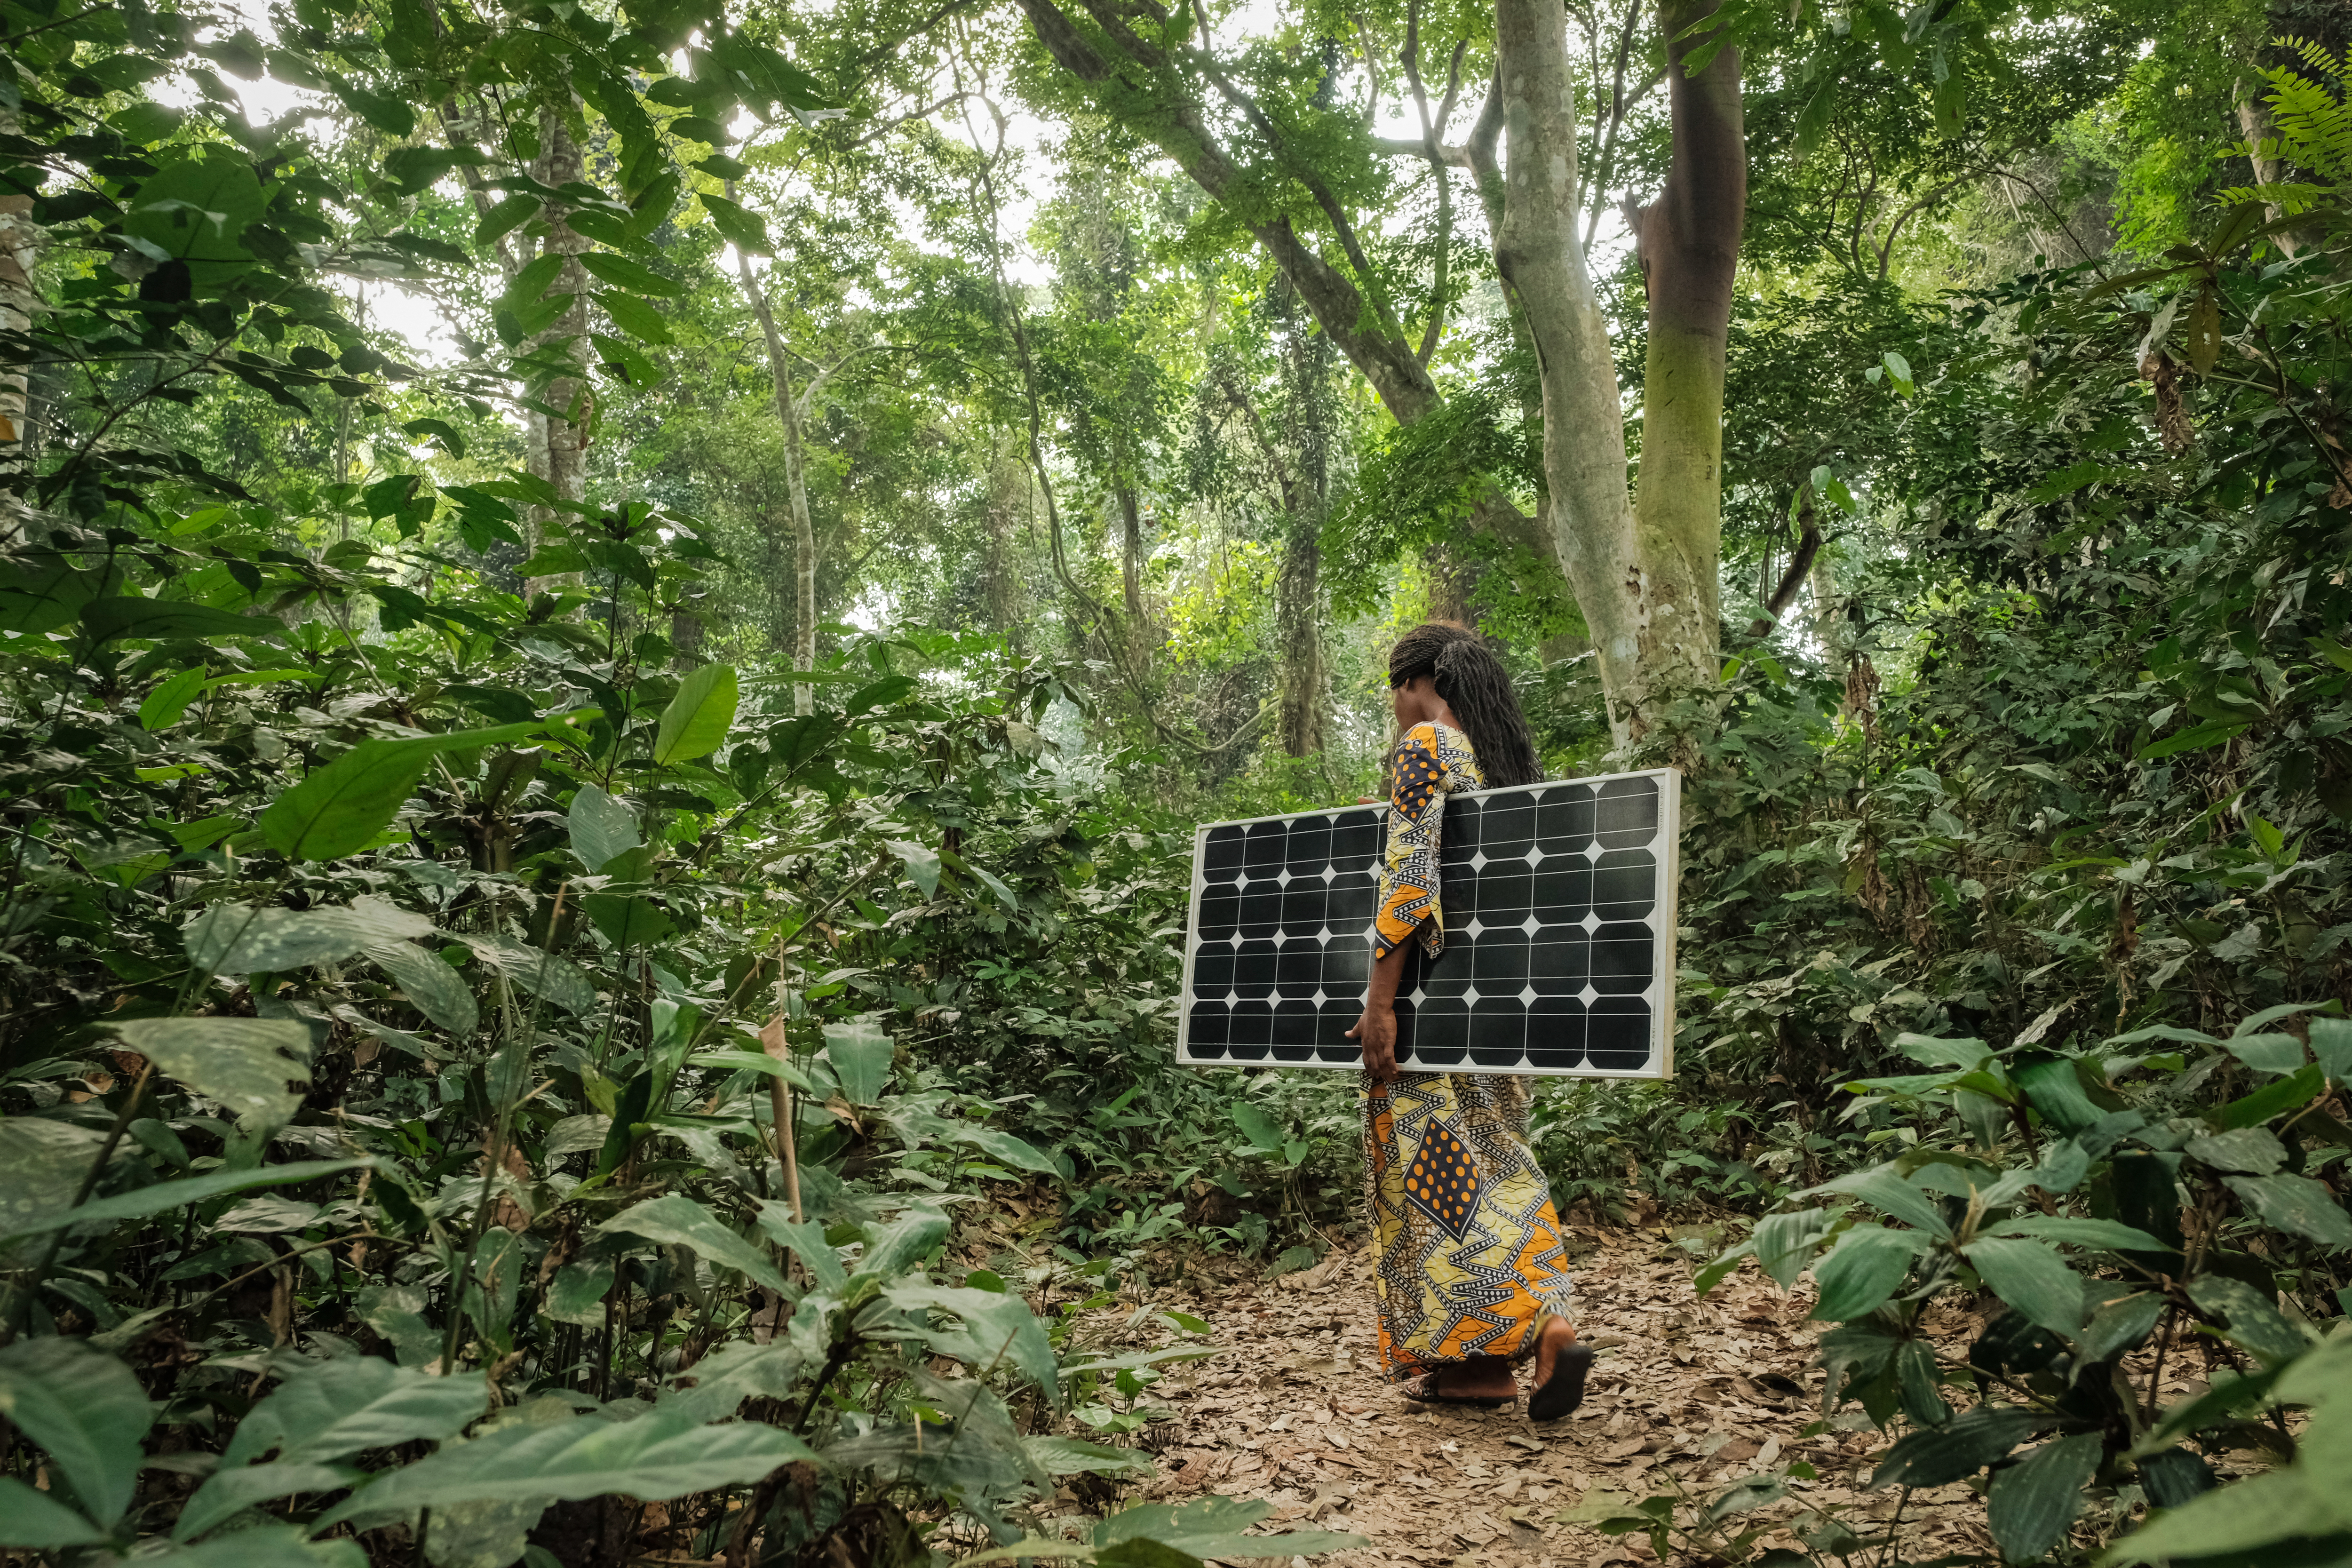
Image of a woman carrying a solar panel near Yangammbi.
Courtesy of Axel Fassio/CIFRO via Flickr
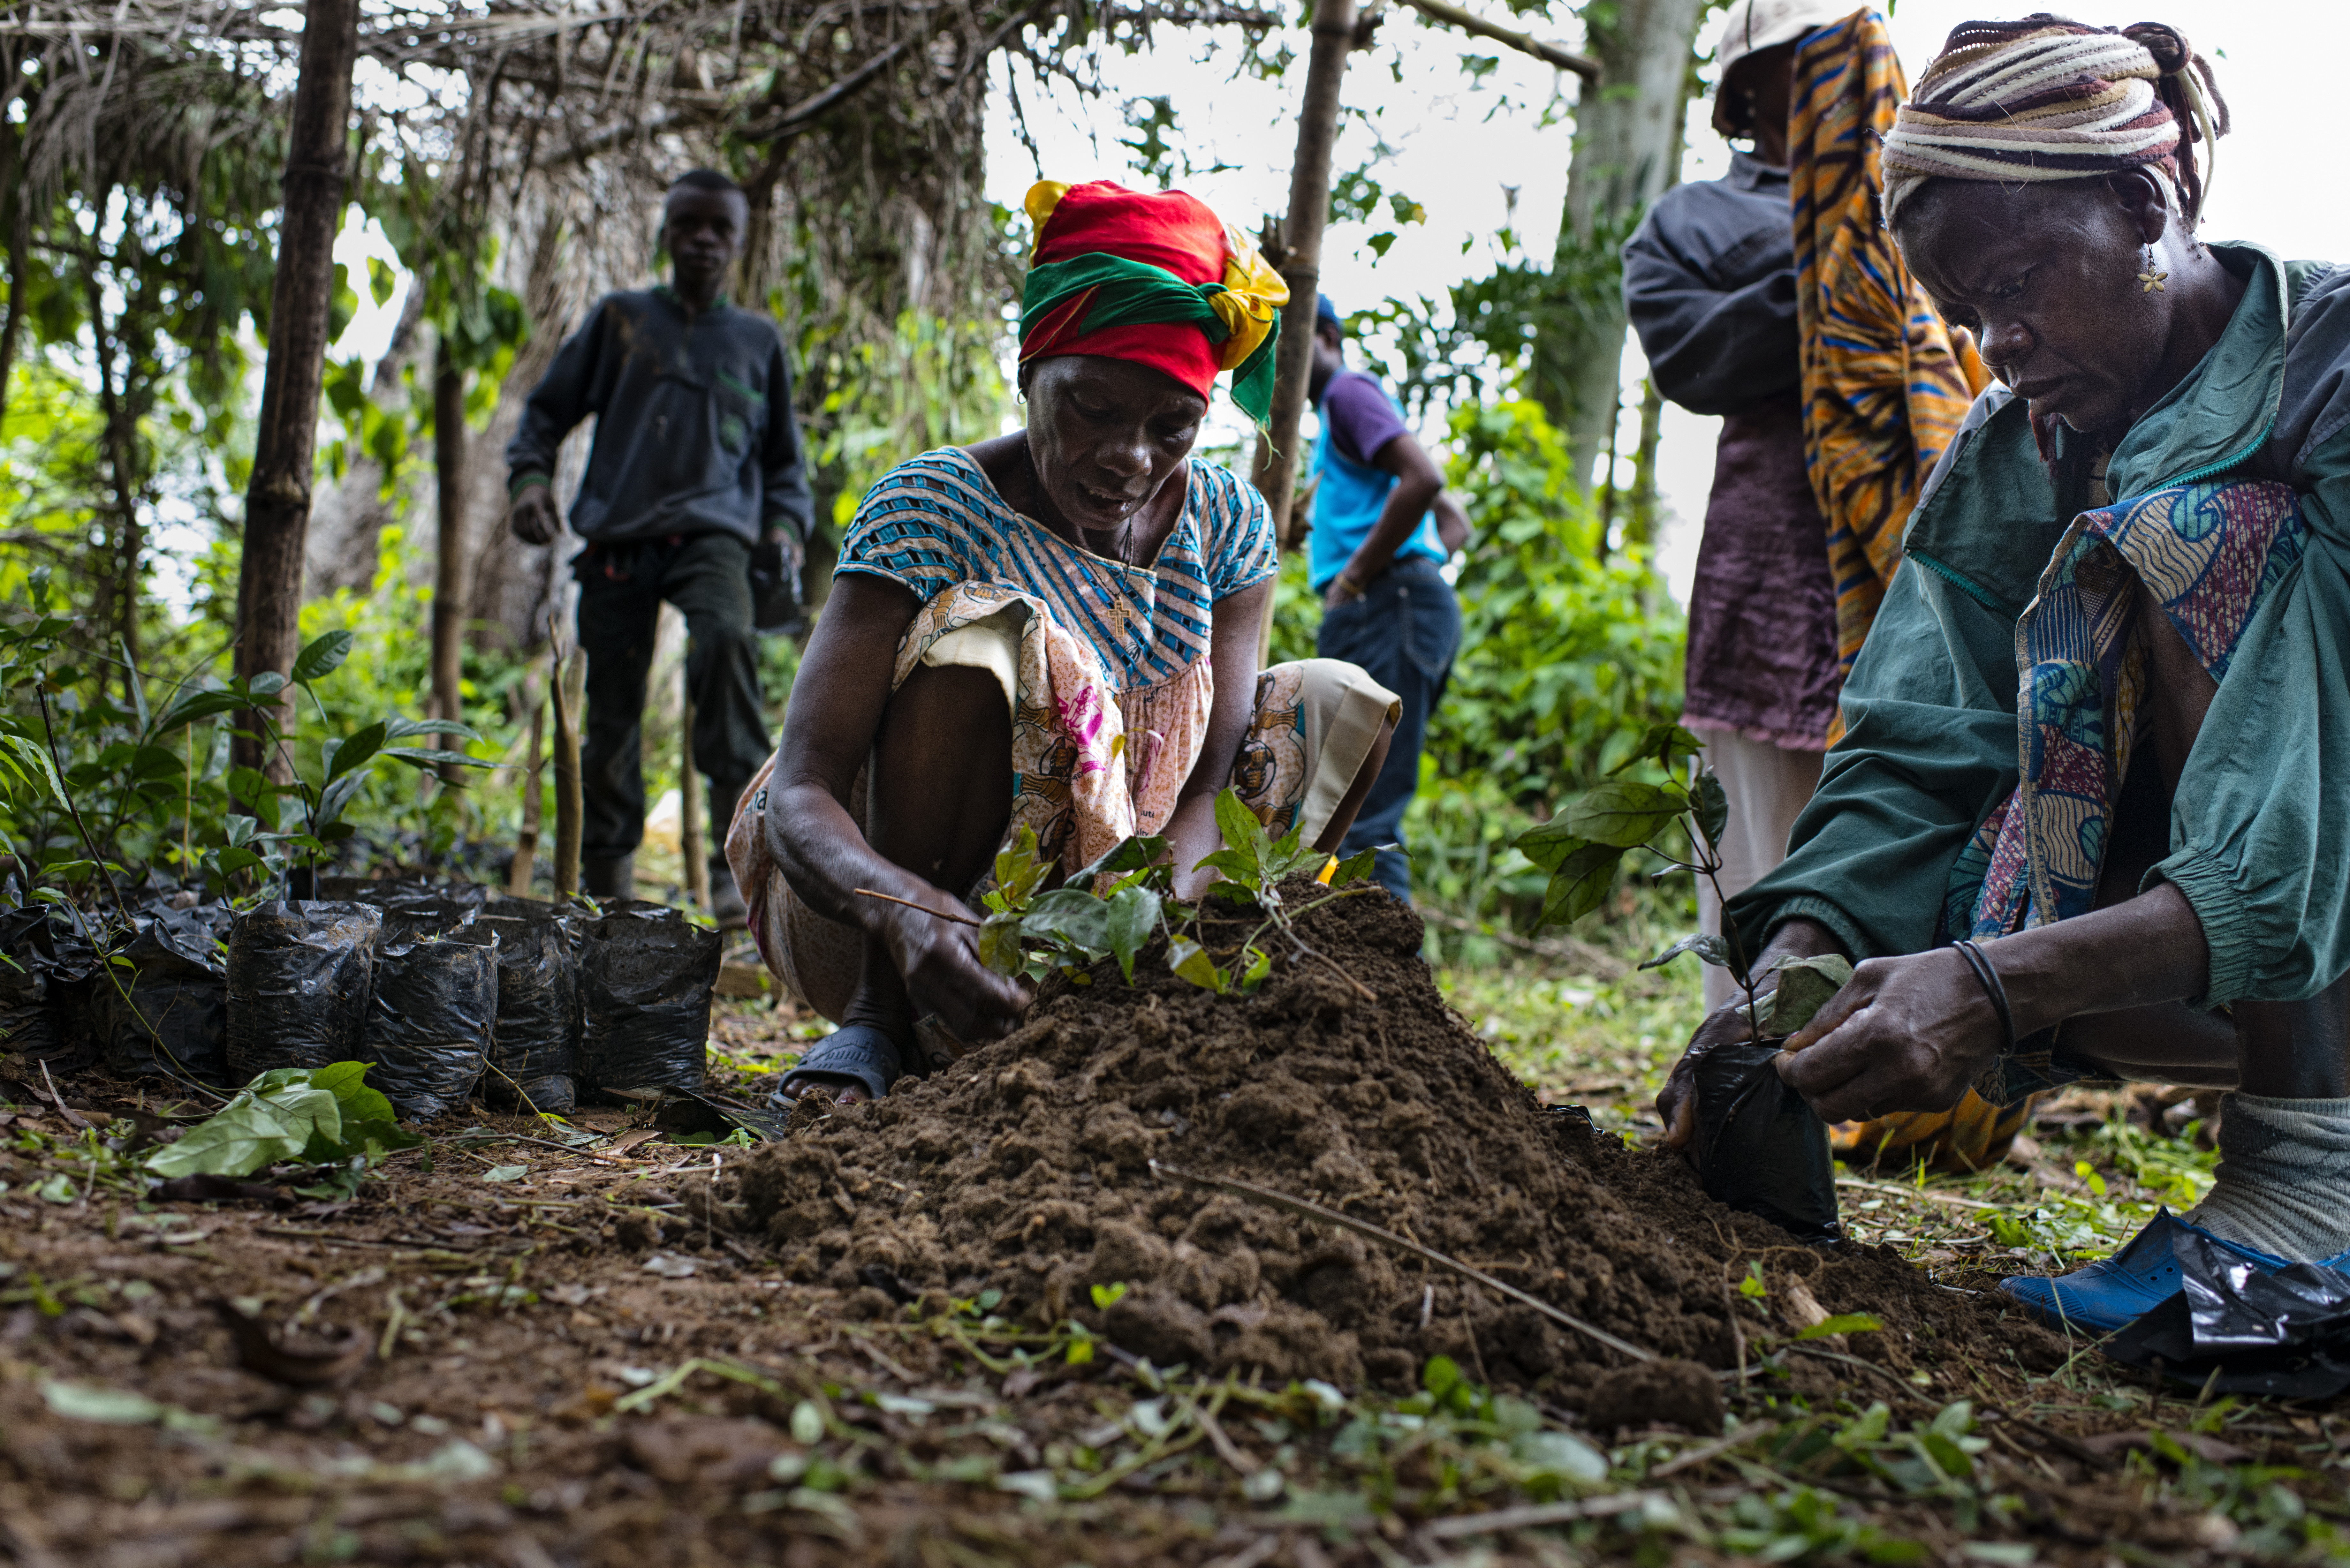
Image of women in agroforestry in the village of Minwoho, Lekié, Center Region, Cameroon.
Courtesy of Ollivier Girard/CIFOR
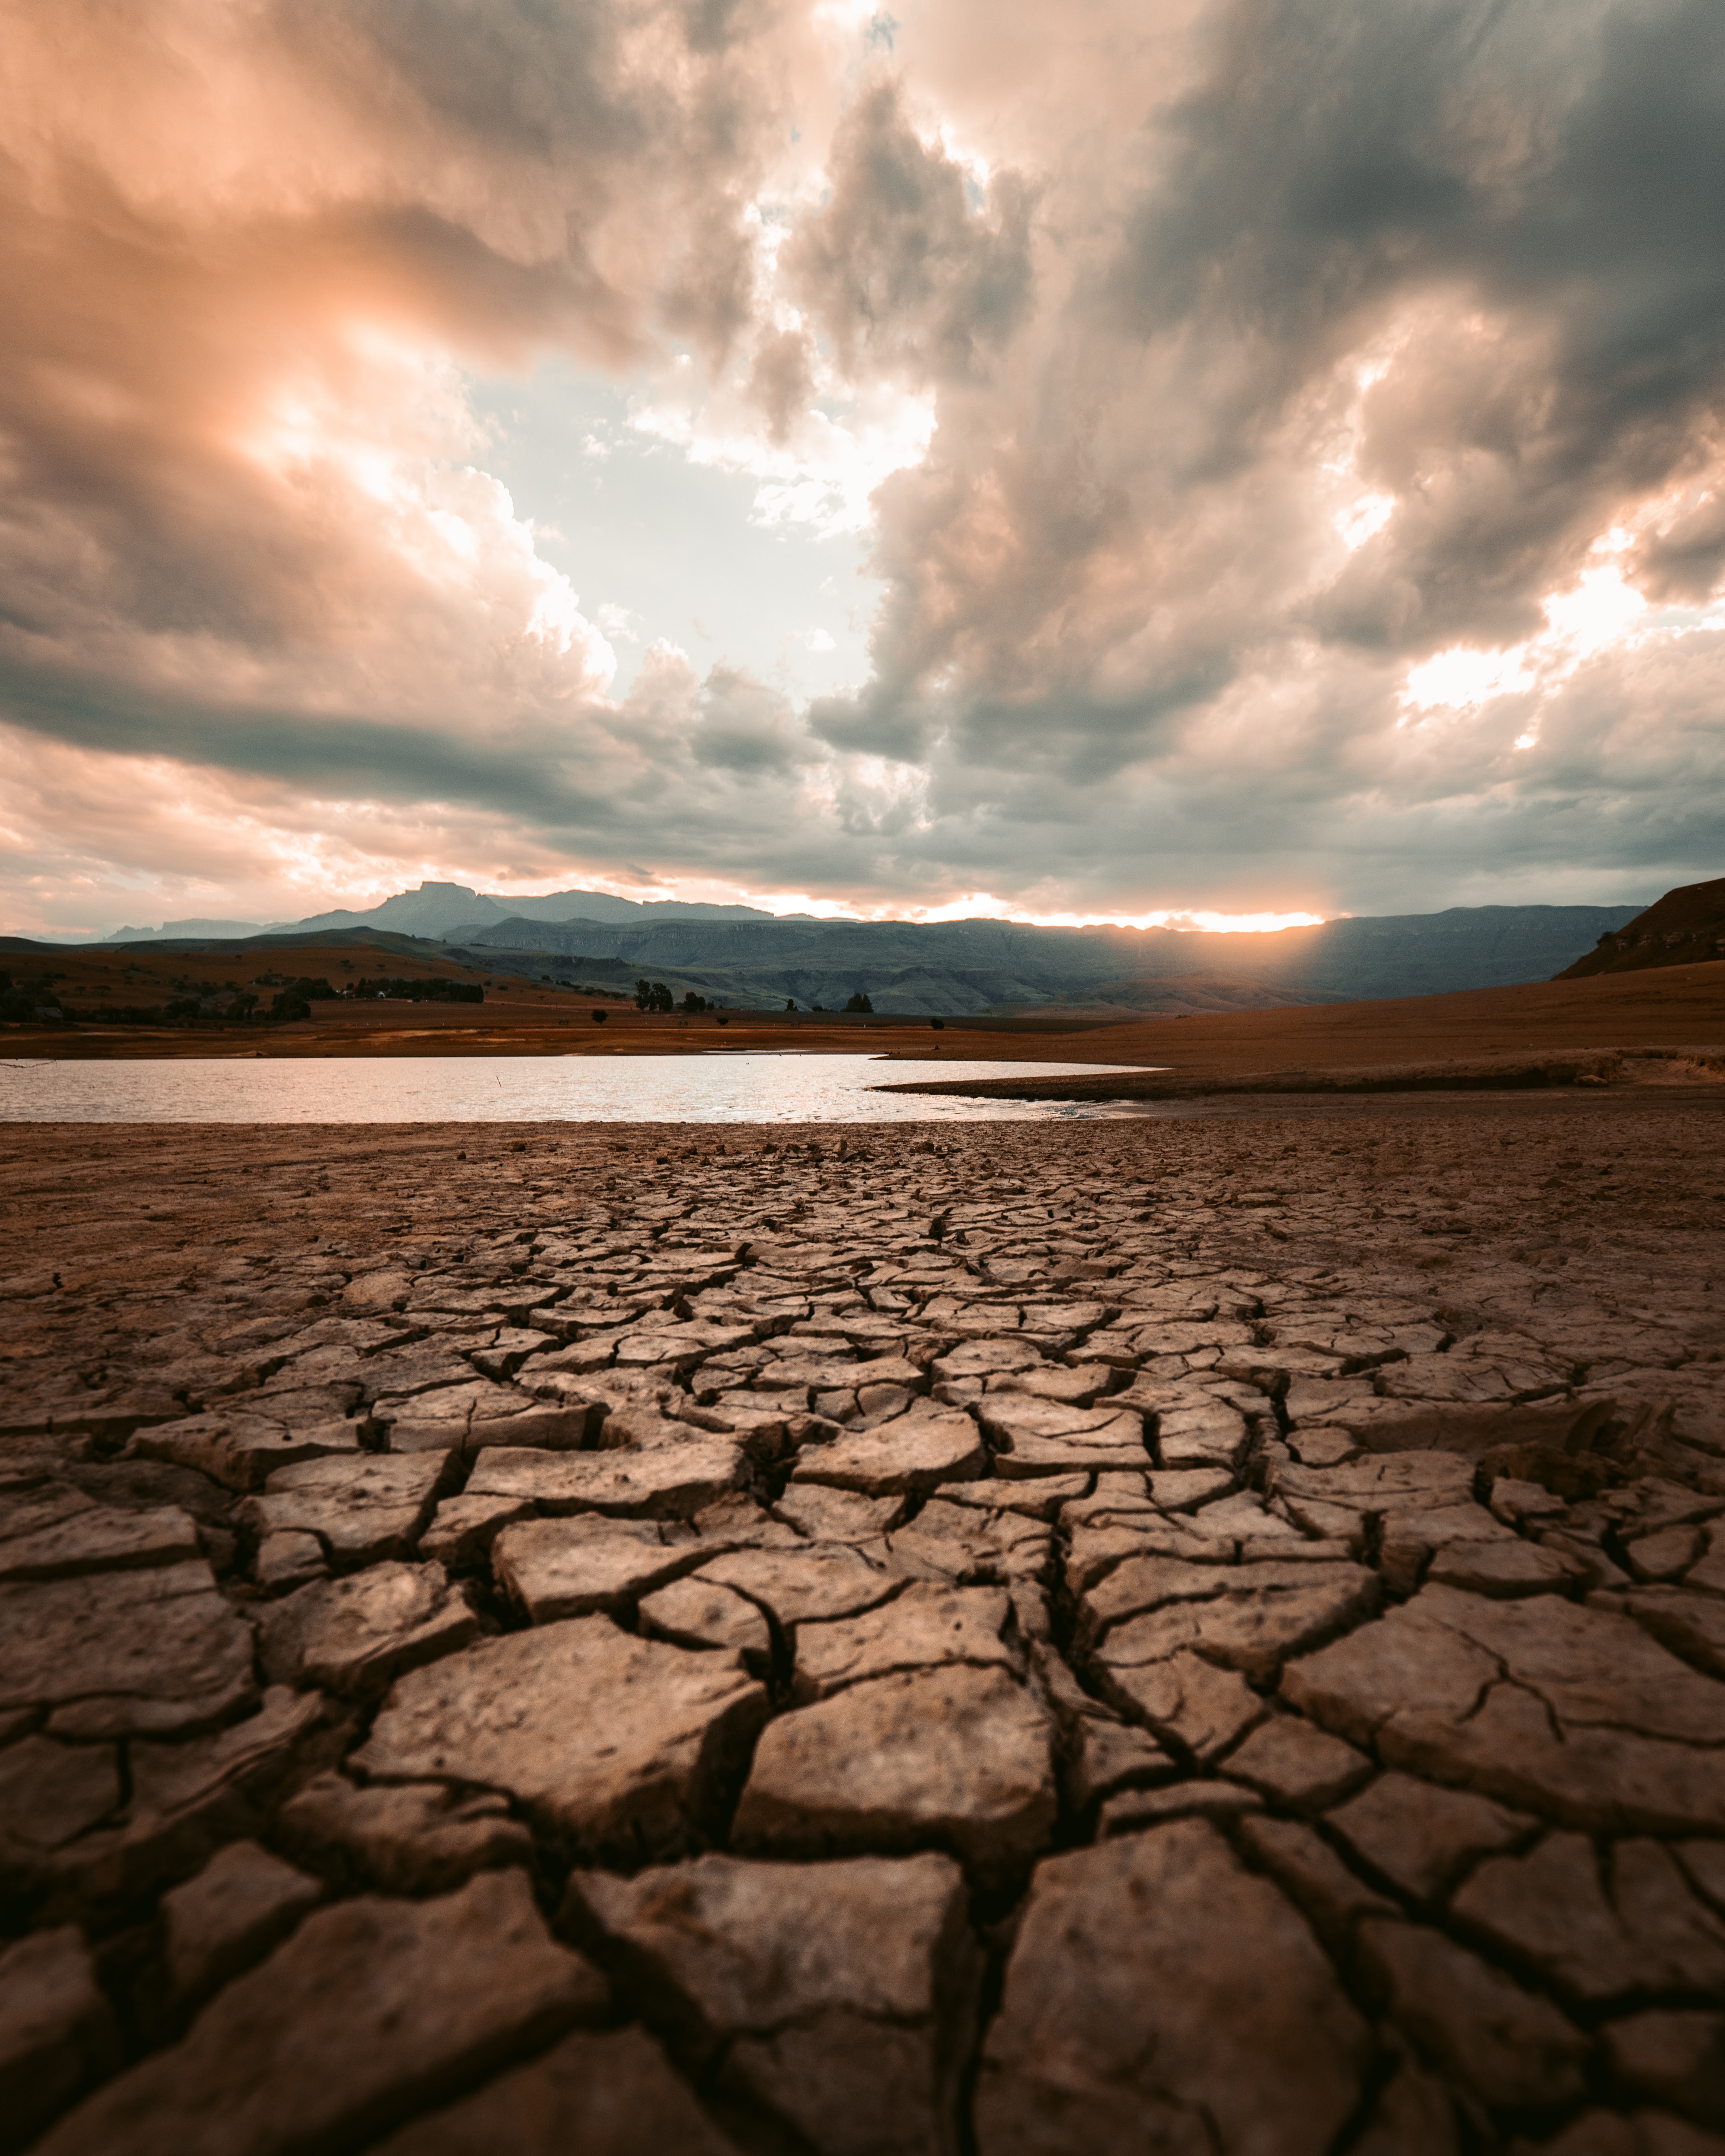
Cracked brown soil.
Courtesy of redcharlie via Unsplash
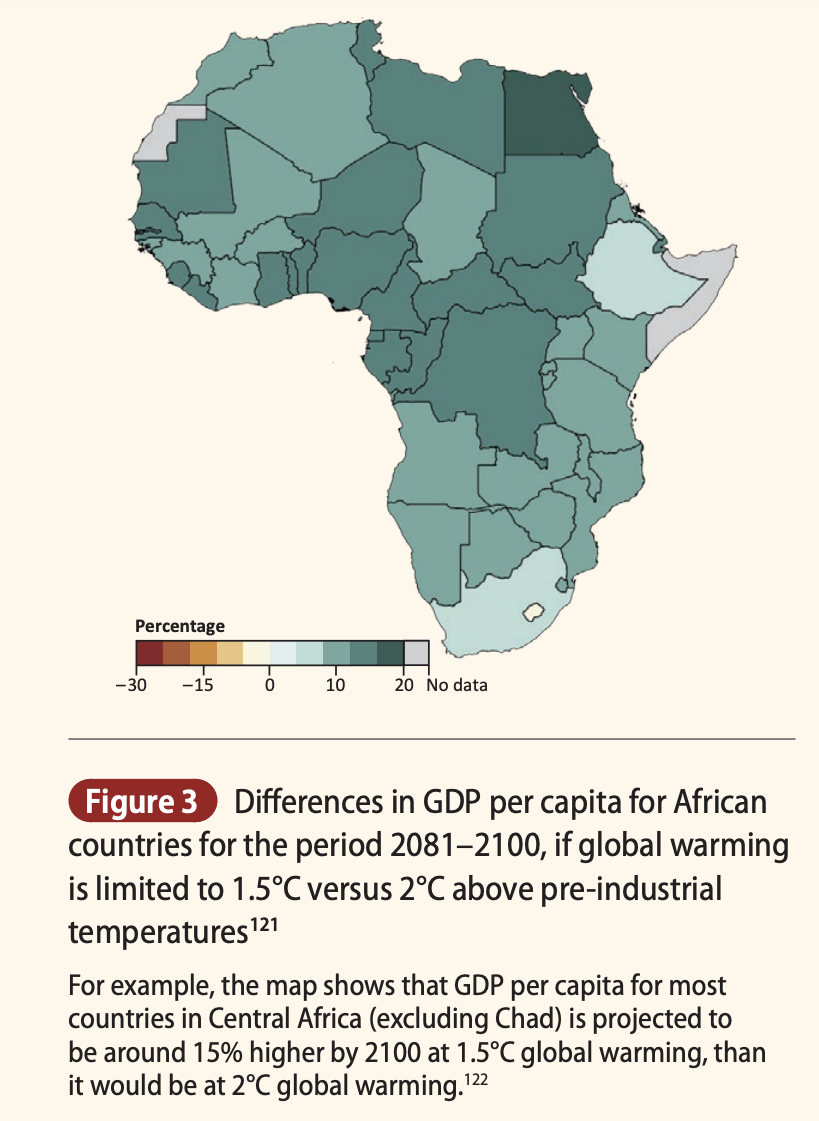
Differences in GDP capita for African countries for the period 2081-2100, if global warming is limited to 1.5°C versus 2°C above pre-industrial temperatures
Courtesy of CDKN
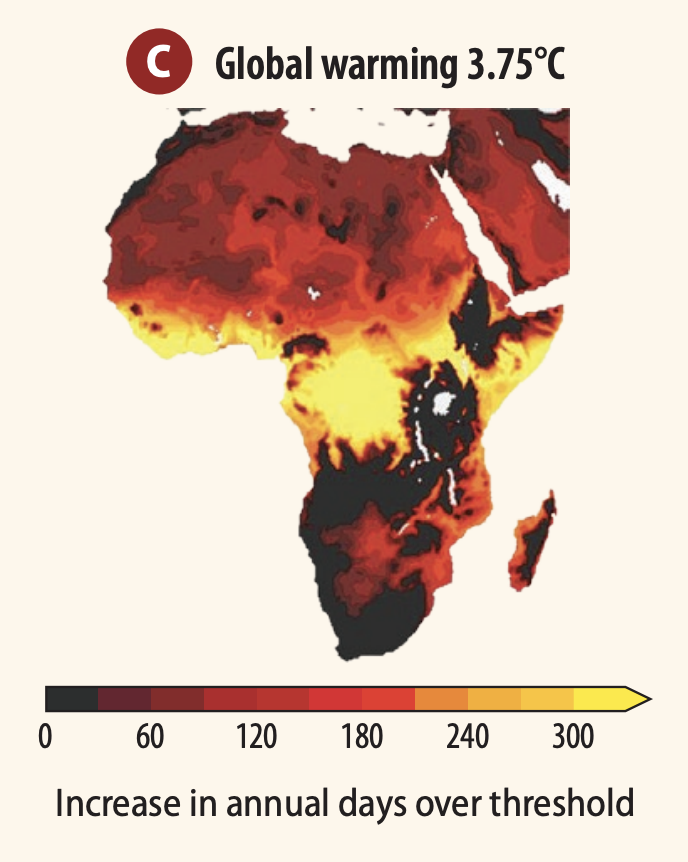
Increase in the number of days per year with severe heat stress for global warming of 3.75°C above pre-industrial levels (1850–2100).
Courtesy of CDKN