Understanding India's emissions pledge
Understanding India's emissions pledge
Radhika Khosla and Navroz K. Dubash of the Centre for Policy Research, Delhi explain what India's Intended Nationally Determined Contribution (INDC) means in context. Their article first appeared on the Climate Initiative blog. The authors are working on a CDKN-funded research project 'Towards a sustainable development-based Indian INDC'.
India’s Intended Nationally Determined Contribution, or INDC, has a headline intensity pledge to reduce emissions intensity 33-35% by 2030 from a 2005 baseline. The form of this pledge makes clear that India’s total emissions will increase through 2030, as is necessary for development, but with emissions growing at a slower pace per unit of GDP. What does this target imply domestically, given India’s development needs, its low emissions base and extremely low per capita emissions? And what does this target mean in the international negotiating context, given the range of INDCs that countries have placed on the table?
Domestic context of the Intensity Pledge
From a domestic perspective, India’s emissions intensity pledge appears to be on the conservative end of the spectrum. A recent analysis of national energy modelling studies shows that the 33-35% number leads to an intensity that falls at the low end of “reference” scenarios (continuing with existing policies) and above the high end of “policy” scenarios (with additional policy effort), as illustrated in Figure 1. As the figure suggests, the target may correspond to relatively low levels of policy effort or even to the normal course of events.
However, benchmarking against predictions from such modelling studies must be approach with caution, as in many cases they do not fully capture the relationship between emission reduction and GDP. Further, given India’s rapidly changing economy and structural transitions, there is a great deal of uncertainty in forecasting the country’s development trajectory. The available studies also provide limited information on achieving the other development goals such as energy security, inclusion and environmental goals, calling into question the comprehensiveness of the projections. A more complete analysis of the emissions intensity pledge would require studies that overcome these shortcomings.
Figure 1: Analysis of India’s Emissions Intensity Pledge - Downloadable PDF
Absolute and per capita emissions implications
The emissions intensity target provides insight into India’s future absolute and per capita emission trends, although the exact numbers are highly contingent on future growth rates. We analyze India’s future emissions scenario in Table 1, for alternative GDP growth rates. We start with the growth rate that corresponds to the 2030 GDP stated in the INDC, of Rs. 397 trillion at 2011-12 prices which is 8.58%. As described below, we also calculate emissions corresponding to two lower estimates of growth rate of 7.5% and 6.5%.
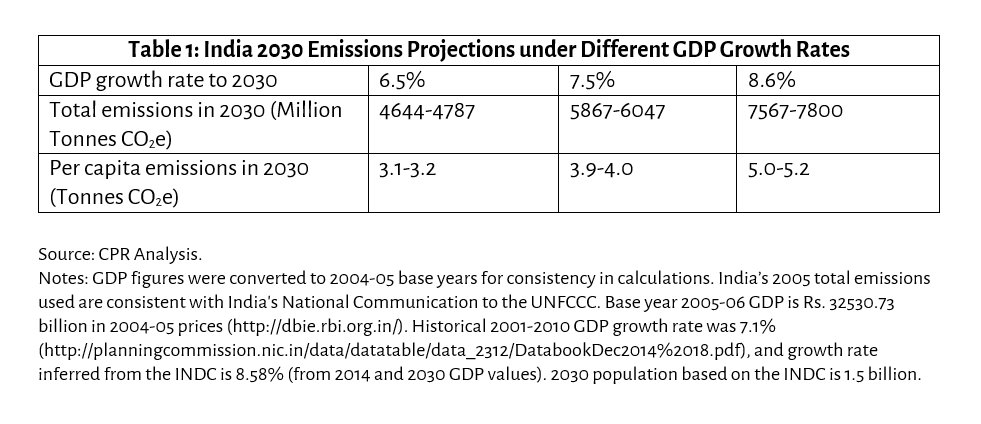
As Table 1 shows, the high end of emissions projections, of around 7500 MT CO2e, are driven by the high GDP assumption in the INDC. However, this 8.6% growth rate assumption is at the very high end of historical averages. Past trends were 6.1% from 1991-2000, 7.1% from 2001-2010, and 5.5% from 2011-2013, with the strongest period of growth from 2004-2012, when growth averaged above 8% (for another analysis, see “Neither Brake nor Accelerator: Assessing India’s Climate Contribution”). There is thus a real question on whether an 8.6% rate can be sustained for the next 15 years. Emissions estimates from lower growth rates should also be considered. The latter result in more moderate numbers, in the range of 4500-6000 MT CO2e, for India’s absolute emissions in 2030. Placing this is an international context, India’s emission projections form a significant share of the global 2030 emissions required for a likely chance of staying within the 2 °C limit, of 42 Gt CO2e. See The UN Environment Programme’s The Emissions Gap Report 2014.
On a per capita basis, on the other hand, the numbers in Table 1 demonstrate that India’s per capita emissions will be much lower than other countries. For instance, per capita emissions for China and the US both are predicted to converge at approximately 12 tonnes per capita in 2030 (see Analysis: India’s climate pledge suggests significant emissions growth up to 2030). And even in 2030, India’s emissions will be much lower than the 2012 global average of 6.6 tonnes per capita (see the World Resources Institute, Climate Analysis Indicators Tool).
International assessments of India’s Intensity Pledge
In the absence of a formal benchmark by which to judge countries’ mitigation targets, a larger international community of researchers and civil society organizations are ranking countries along a number of different metrics. For example, based on a combined assessment of different equity and capability indices, India’s INDC is rated “medium” according to the Climate Action Tracker. If, on the other hand, the metric is one of equity, the assessments rate India as broadly meeting its indicative share of effort – see the Climate Equity Reference Calculator. Another ranks India as “less ambitious” along three definitions of ambition, none of which account for equity: target emissions trajectory, target emissions intensity and abatement needed to hit target vs. emissions estimate. As these different indicators suggest, the outcome depends a great deal on the metric. India ranks high in an equity focused indicator, less well on a more narrow ‘ambition’ index, and medium on an index that combines metrics.
When domestic and international comparisons are taken together, the relative judgment of India’s emissions intensity target alone (and not other mitigation components of the INDC) is that the target is at par, or middle of the road, from both a domestic and international perspective. A full picture requires a complementary examination of other aspects of India’s INDC, including sectoral targets such as for the electricity sector, which we will analyze in subsequent blogs.
The authors are Fellow and Senior Fellow respectively at the Centre for Policy Research, New Delhi.
For a detailed analysis of India’s INDC by the authors see in the Economic and Political Weekly (October 17, 2015 issue).
Image: credit Aaron de Leeuw, flickr.com