Using the IPCC's Interactive Atlas to understand how Africa's climate is changing
Using the IPCC's Interactive Atlas to understand how Africa's climate is changing
In August 2021, the Intergovernmental Panel on Climate Change (IPCC) released the Sixth Assessment Report of Working Group 1 (WGI): Climate Change 2021, The Physical Science Basis. The report highlights how human activities are already having a significant impact on our climate and stresses the urgency of reducing carbon dioxide (CO2) emissions to avoid warming beyond 1.5℃ - 2℃ above preindustrial levels. Along with their landmark report, WGI also released the interactive atlas. The atlas allows users to explore different regions of the world to see how climate variables might change in the near, medium and long term, and at different levels of global warming.
Roy Bouwer of SouthSouthNorth explored the atlas and presents here a guide on how to use it - based on his exploration of African data.
How to use the interactive atlas:
Step 1:
At first glance, the interactive atlas is quite intimidating to use. There are various datasets, variables and regions to choose from, so a good starting point is to select the scale you're interested in and your preferred detail of uncertainty. Using the dropdown menus on the map you can select either the global, continental, regional, river basin, monsoon or small island scale as well as simple, advanced or no uncertainty.

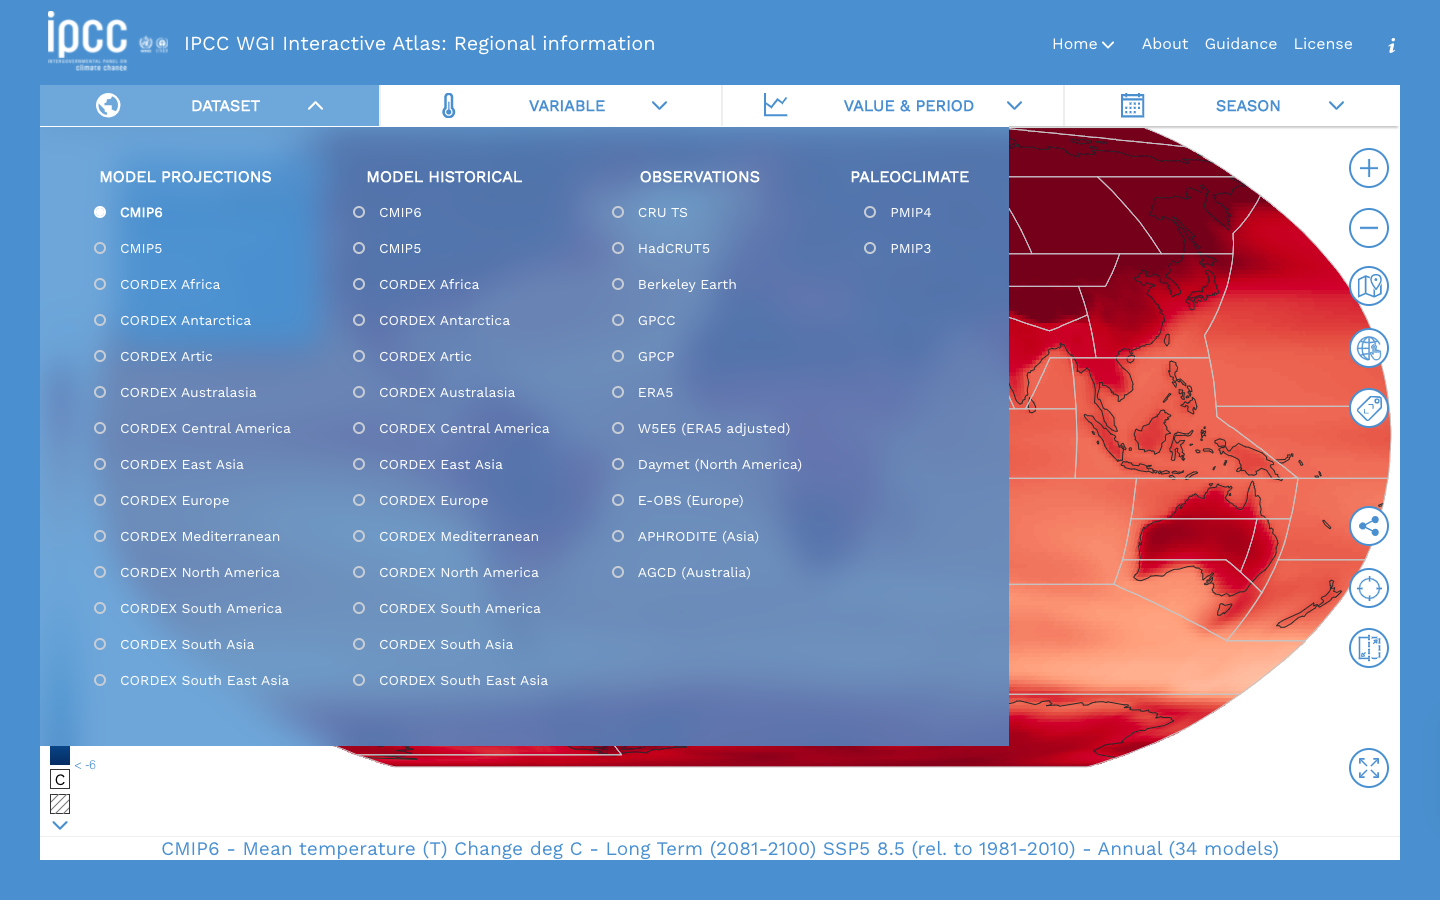
Step 2:
Once you’ve selected your preferred scale, you can now select your prefered DATASET for future, historical, observational and paleoclimate simulations (for future changes we will just be using the default CMIP6 dataset).
Step 3:
From here you can select what changes you are interested in under the VARIABLES dropdown menu. Here you can choose from average temperature and rainfall or other extremes.

Step 4:
Next, you select either the level of warming or the time period you are interested in under the VALUE & PERIOD dropdown menu. Under this dropdown, you can also adjust the Shared Socio-Economic Pathways (SSP). These represent different socio-economic, mitigation and adaptation scenarios to project future climate change. (SSP1-2.6 and SSP2-4.5 represent low emission scenarios with late century negative emissions in the former; and more, non-CO2 reductions in the latter. SSP3-7 and SSP5-8.5 represent high and very high ‘worst case’ emission scenarios respectively with emissions continuing to increase throughout the century.) Then, select the baseline period you would like to measure changes against.

Step 5:
From here, you can choose whether you are interested in annual changes or seasonal changes in the SEASON dropdown option.

Step 6:
Once you have selected the data you are interested in, you can select the area that you are interested in seeing this data for, by clicking the area on the map. Your data will then appear in various formats on the bottom of the map - where you can expand the popup or download the pdf or png file to have a look at the data you’ve selected.

What does the atlas tell us about the future climate of Africa?
Africa is likely to warm much quicker than global averages, with average temperatures across the continent increasing by 1.8℃ and 2.4℃ at 1.5℃ and 2℃ of global warming against pre-industrial levels, respectively. By the end of the century, temperatures could increase by 5℃ compared to recent temperatures (1981-2010). Warmer average temperatures will also mean increases in maximum temperatures, with significant increases in the number of days with temperatures exceeding 35℃, particularly in central Africa and the Sahara.
Projections for average rainfall are much more uncertain, but will likely vary across the continent. The greatest expected increase is in parts of the Sahara which could receive an increase of 17% in annual rainfall compared to recent levels (1981-2010). Large portions of east Africa, central Africa and west Africa are also expected to see increases in annual rainfall, while southern and northern Africa will likely see less rainfall. Extreme rainfall is likely to increase across the continent, particularly in the Sahara, west Africa, central Africa and east Africa and less significantly in southern and northern Africa. Dry days are expected to increase significantly in southern and northern Africa, with modest decreases expected in Sahara and east Africa and slight increases or decreases in central and west Africa.
What does this mean?
Increasing temperatures and increasing rainfall variability will have significant impacts on water availability, agriculture and food security, and human health and wellbeing across Africa. Increasing climate extremes will mean Africa will be at an increasing risk of disasters such as drought, flooding, heat waves and more. The vulnerability of the continent and relative low capacity to respond to these increasing risks requires a global effort to limit warming to 1.5℃ above pre-industrial levels. The upcoming COP26 conference will be vital to ensuring global leaders commit to reducing greenhouse gas emissions and mobilise funding to support adaptation deficits across the continent, in order to safeguard the economies and people of Africa.
For further details on how Africa’s climate is changing see the IPCC regional fact sheet: https://www.ipcc.ch/report/ar6/wg1/downloads/factsheets/IPCC_AR6_WGI_Regional_Fact_Sheet_Africa.pdf
All graphics on this page are screenshots from the IPCC Working Group I's Interactive Atlas.