Southern Africa
Southern Africa
The IPCC’s Sixth Assessment Report: What’s in it for southern Africa?
This factsheet highlights:
- How southern Africa’s climate is already changing
- Southern Africa’s future climate
- Climate change impacts we have already seen in southern Africa
- Future climate risks in southern Africa
- Southern Africa’s potential to adapt
- Key investment areas for a climate-resilient southern Africa
Explore the factsheet, along with free-to-use images and infographics, below.
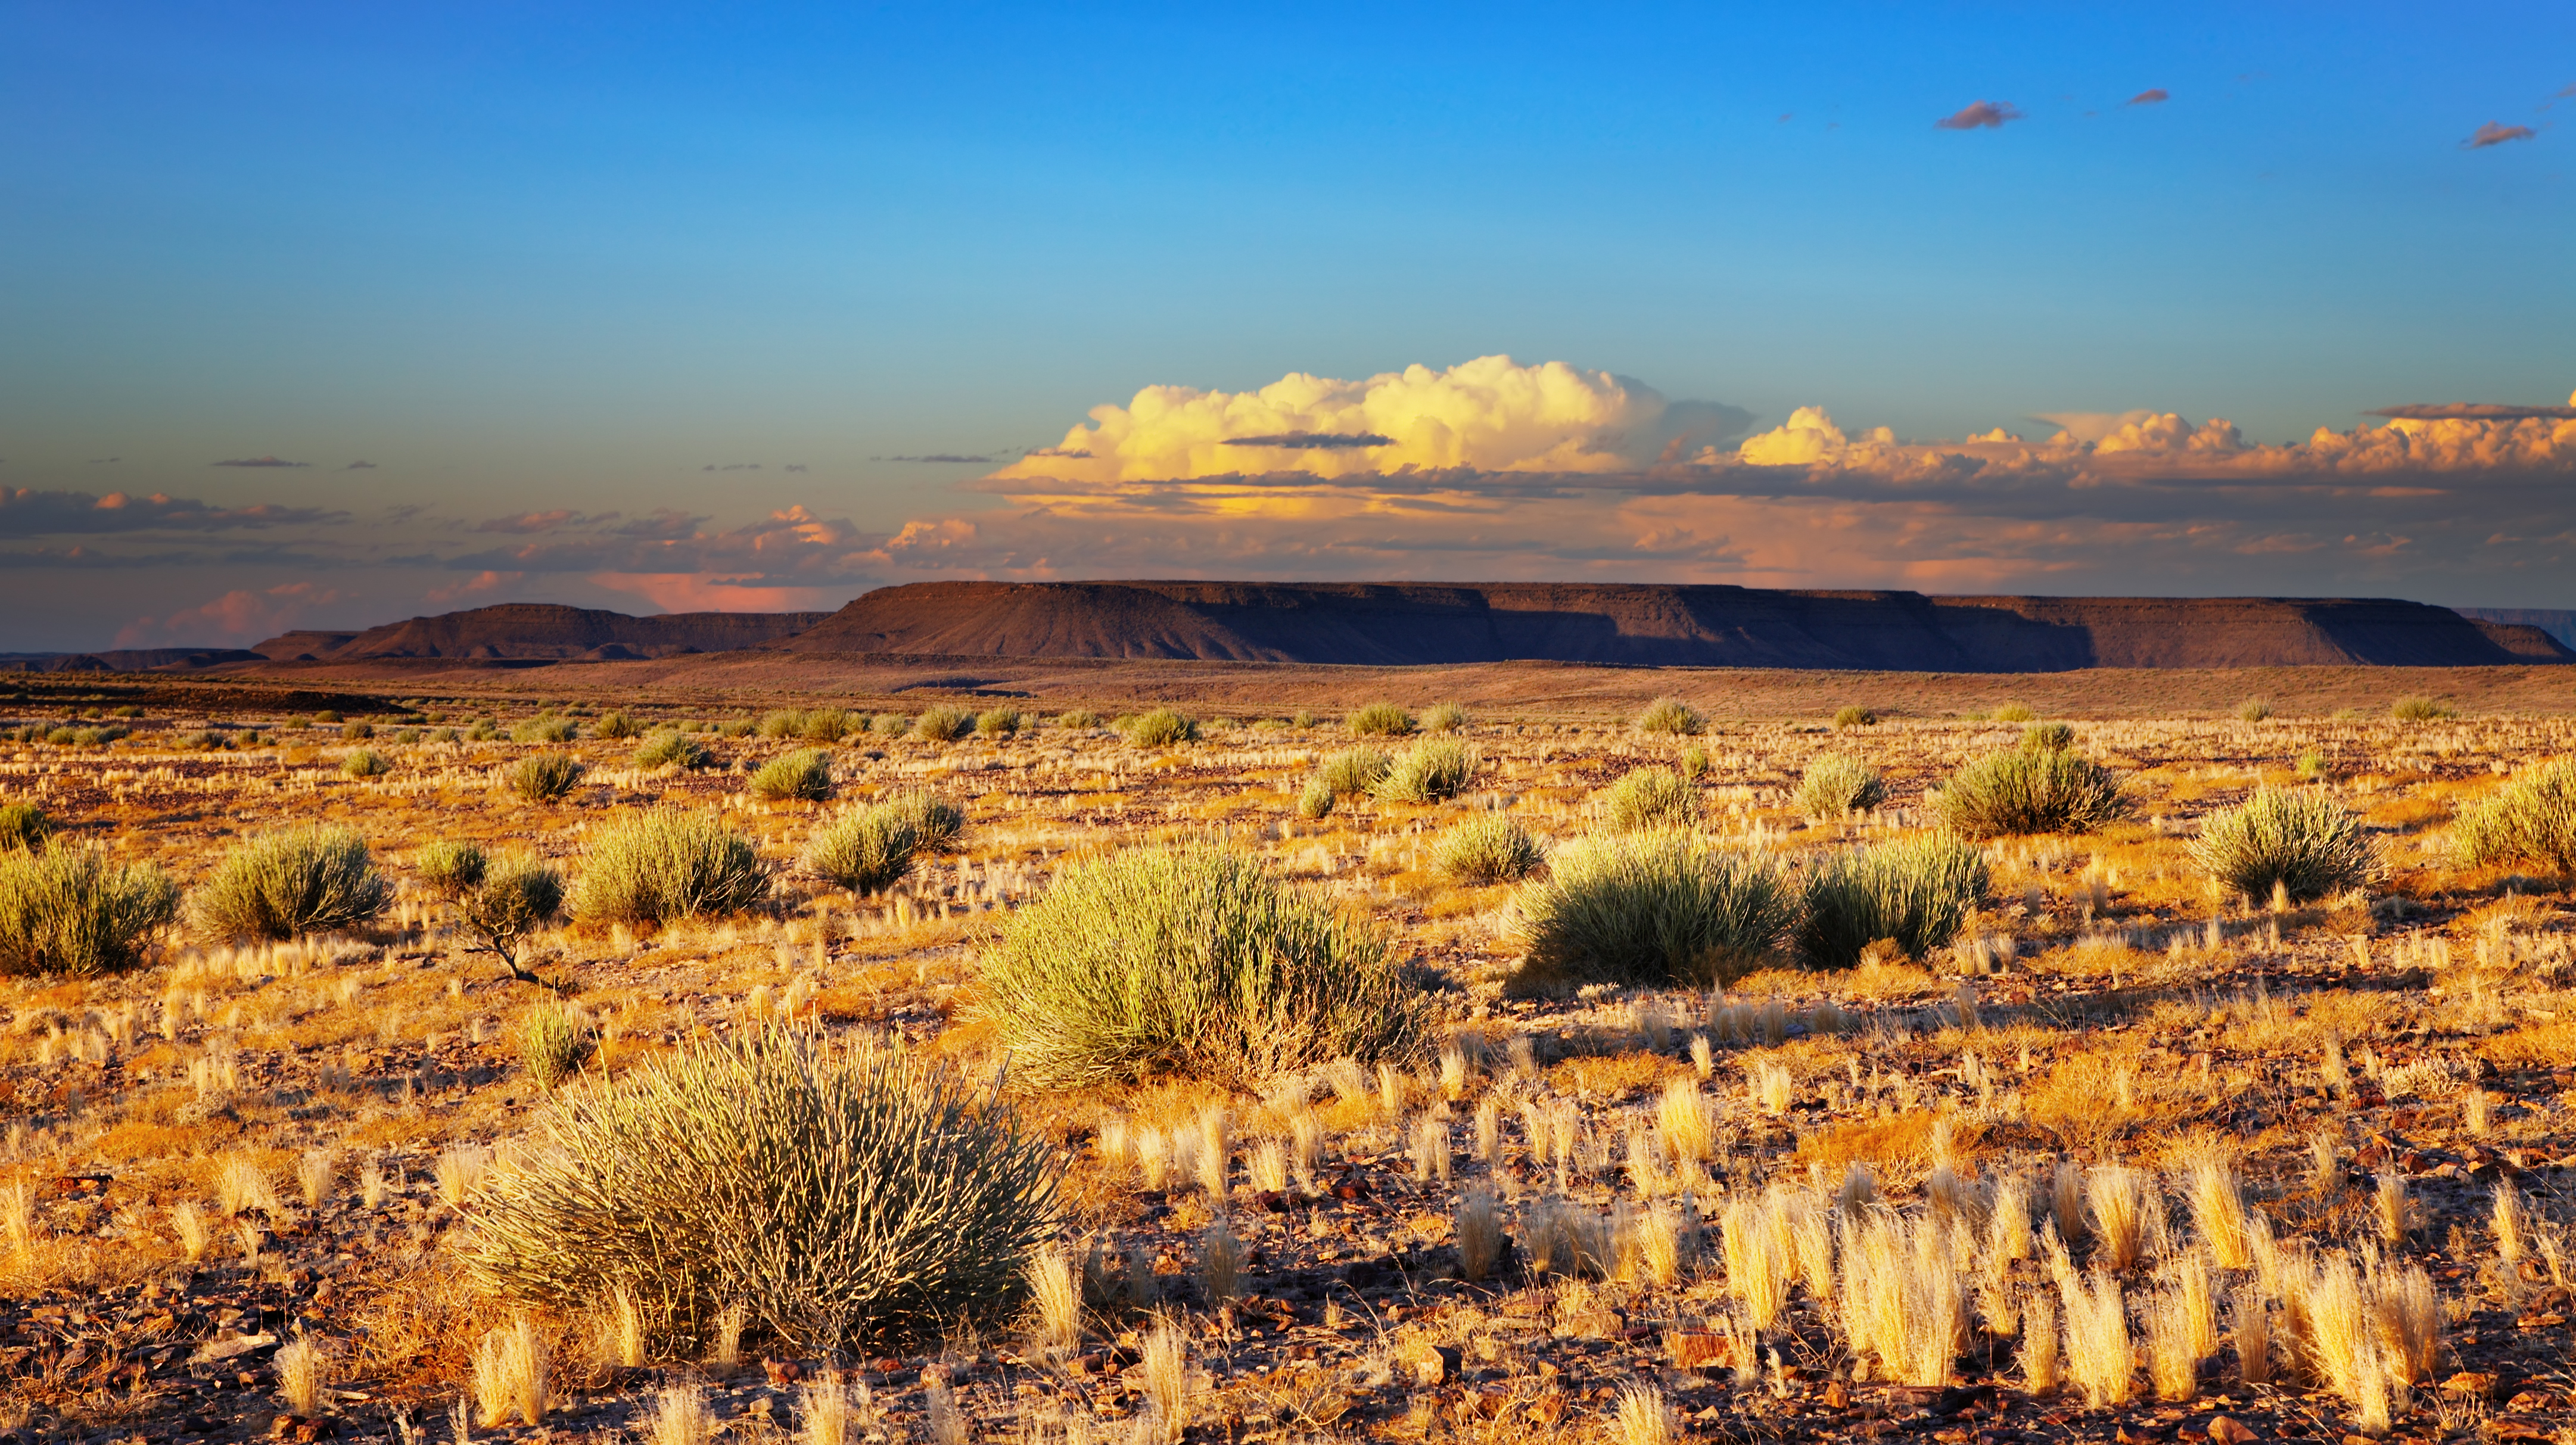
Image of sunset in the Kalahari, Namibia
Courtesy of Dmitry Pichugin via Shutterstock

Image of forest fire
Courtesy of Matt Palmer via Unsplash

Image of sunset over the ocean
Courtesy of matthew Feeney via Unsplash
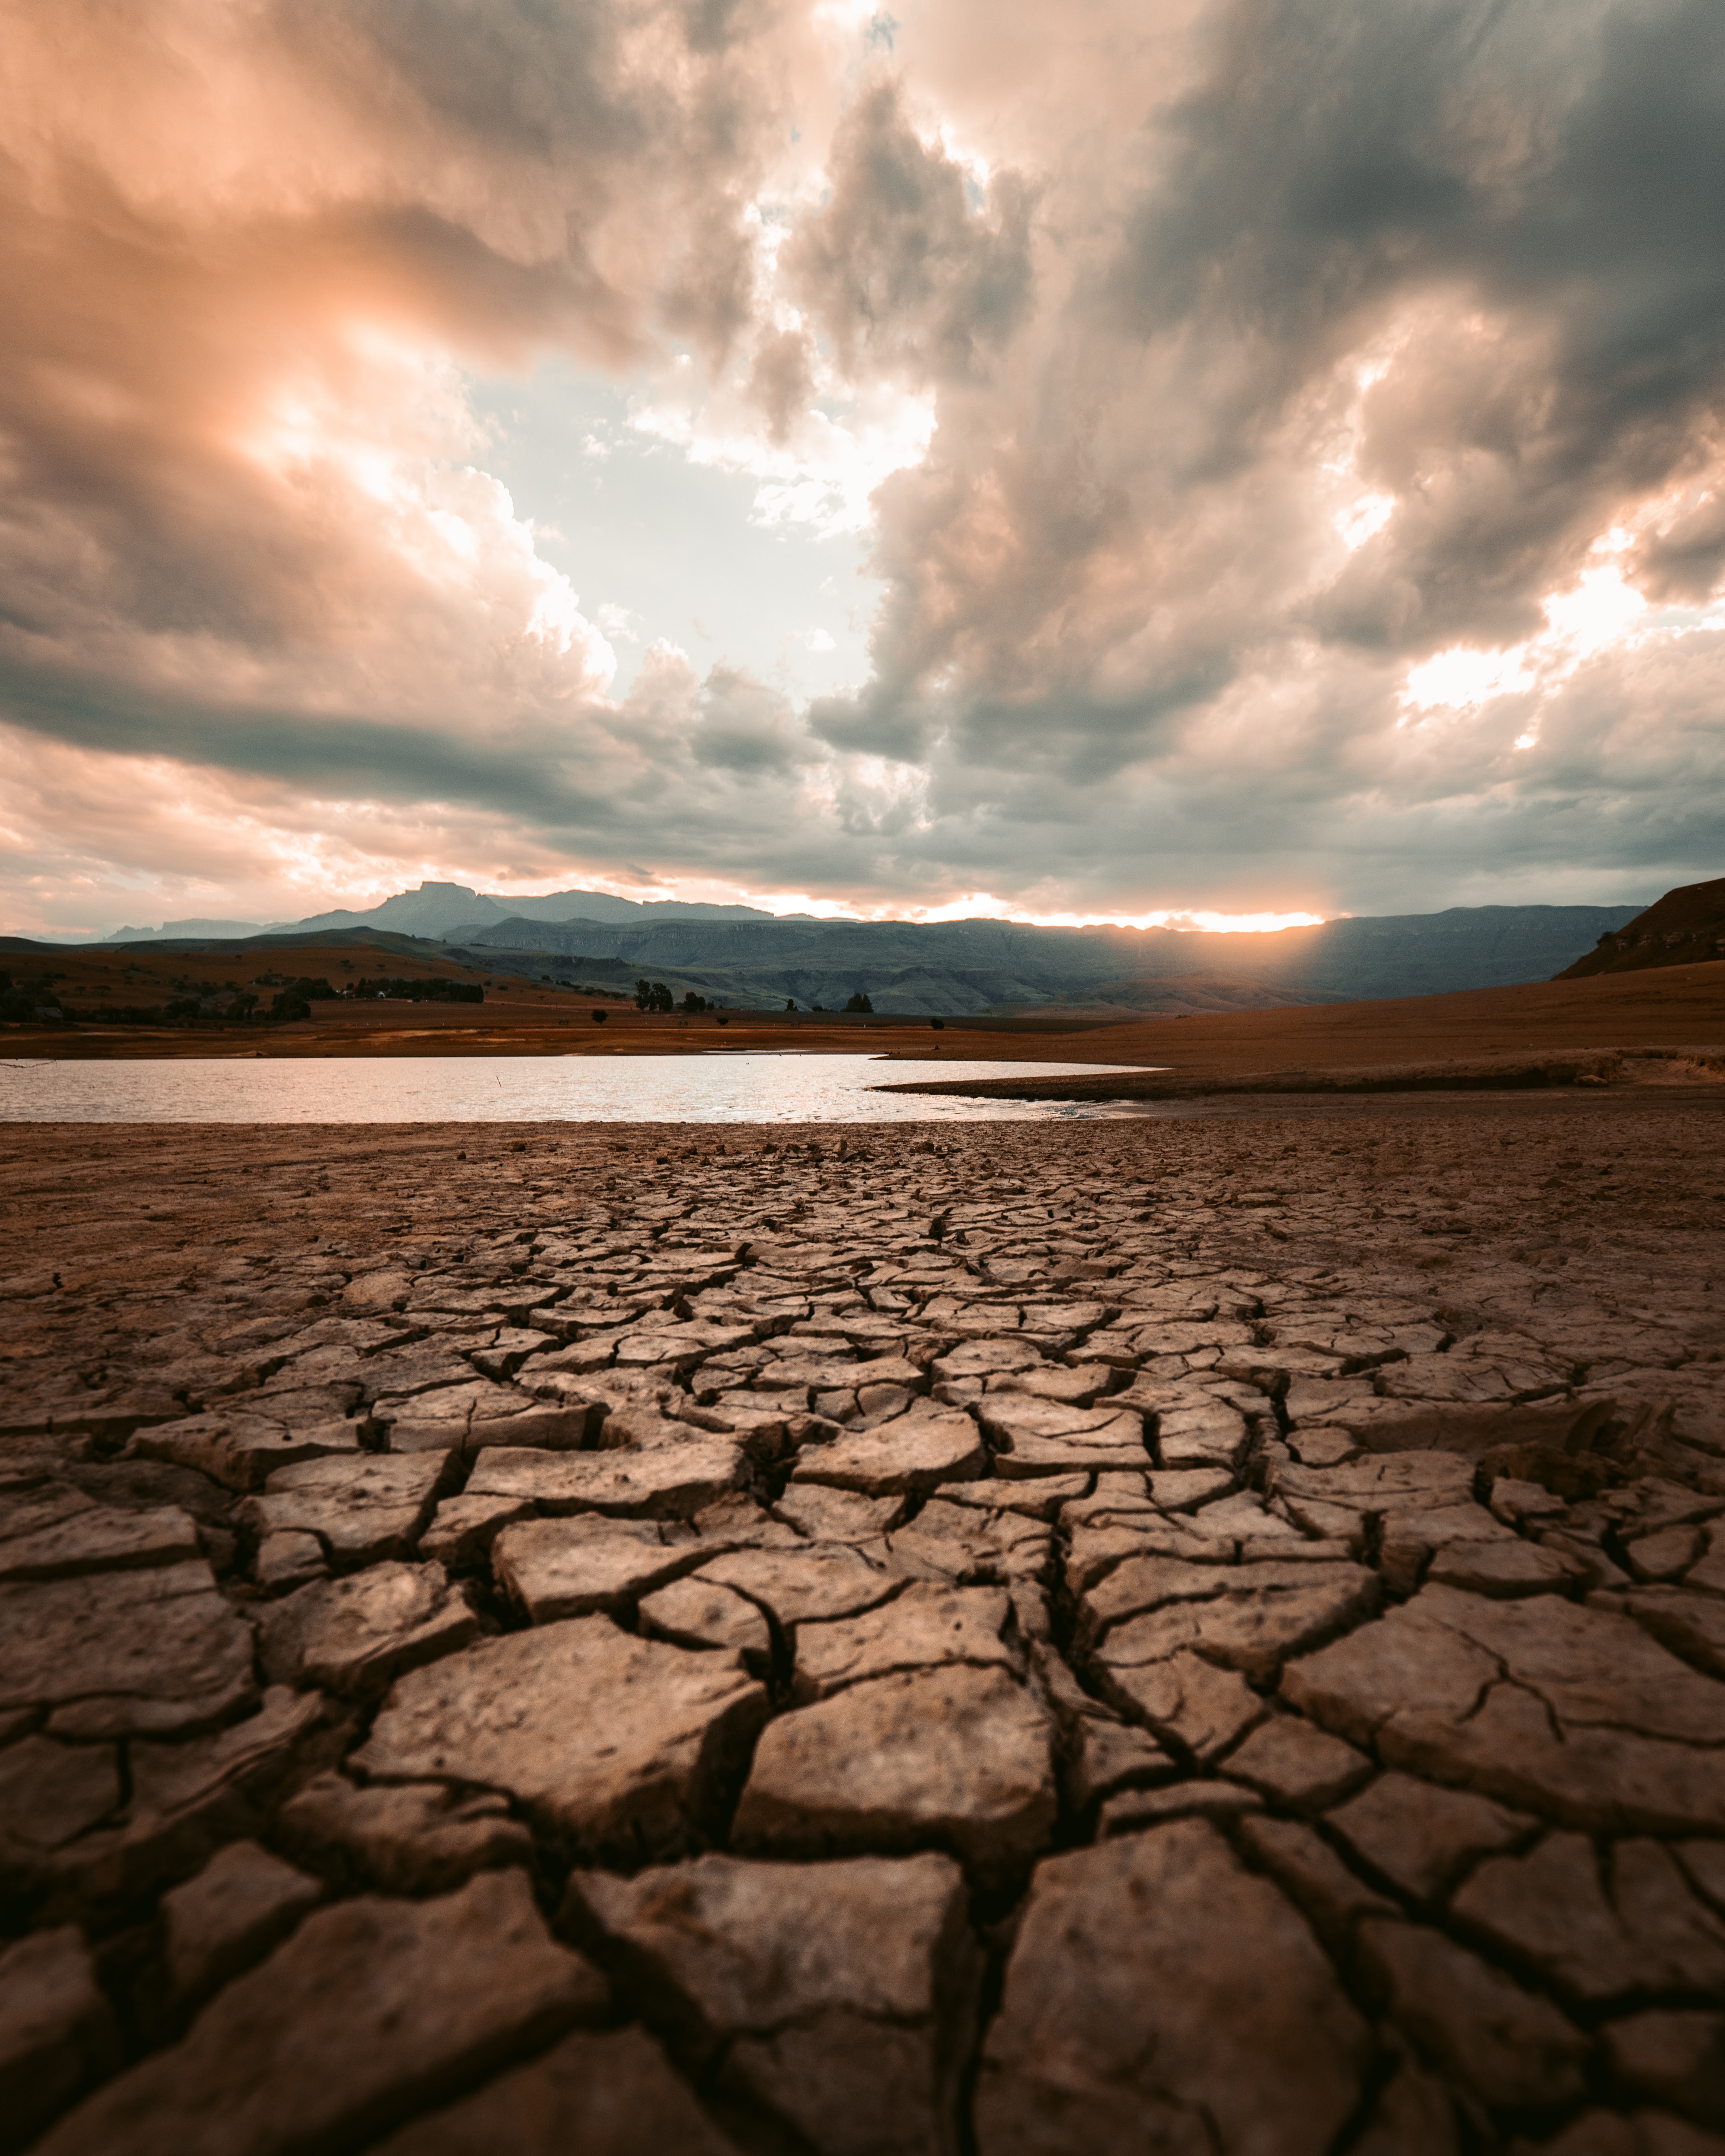
Cracked brown soil.
Courtesy of redcharlie via Unsplash
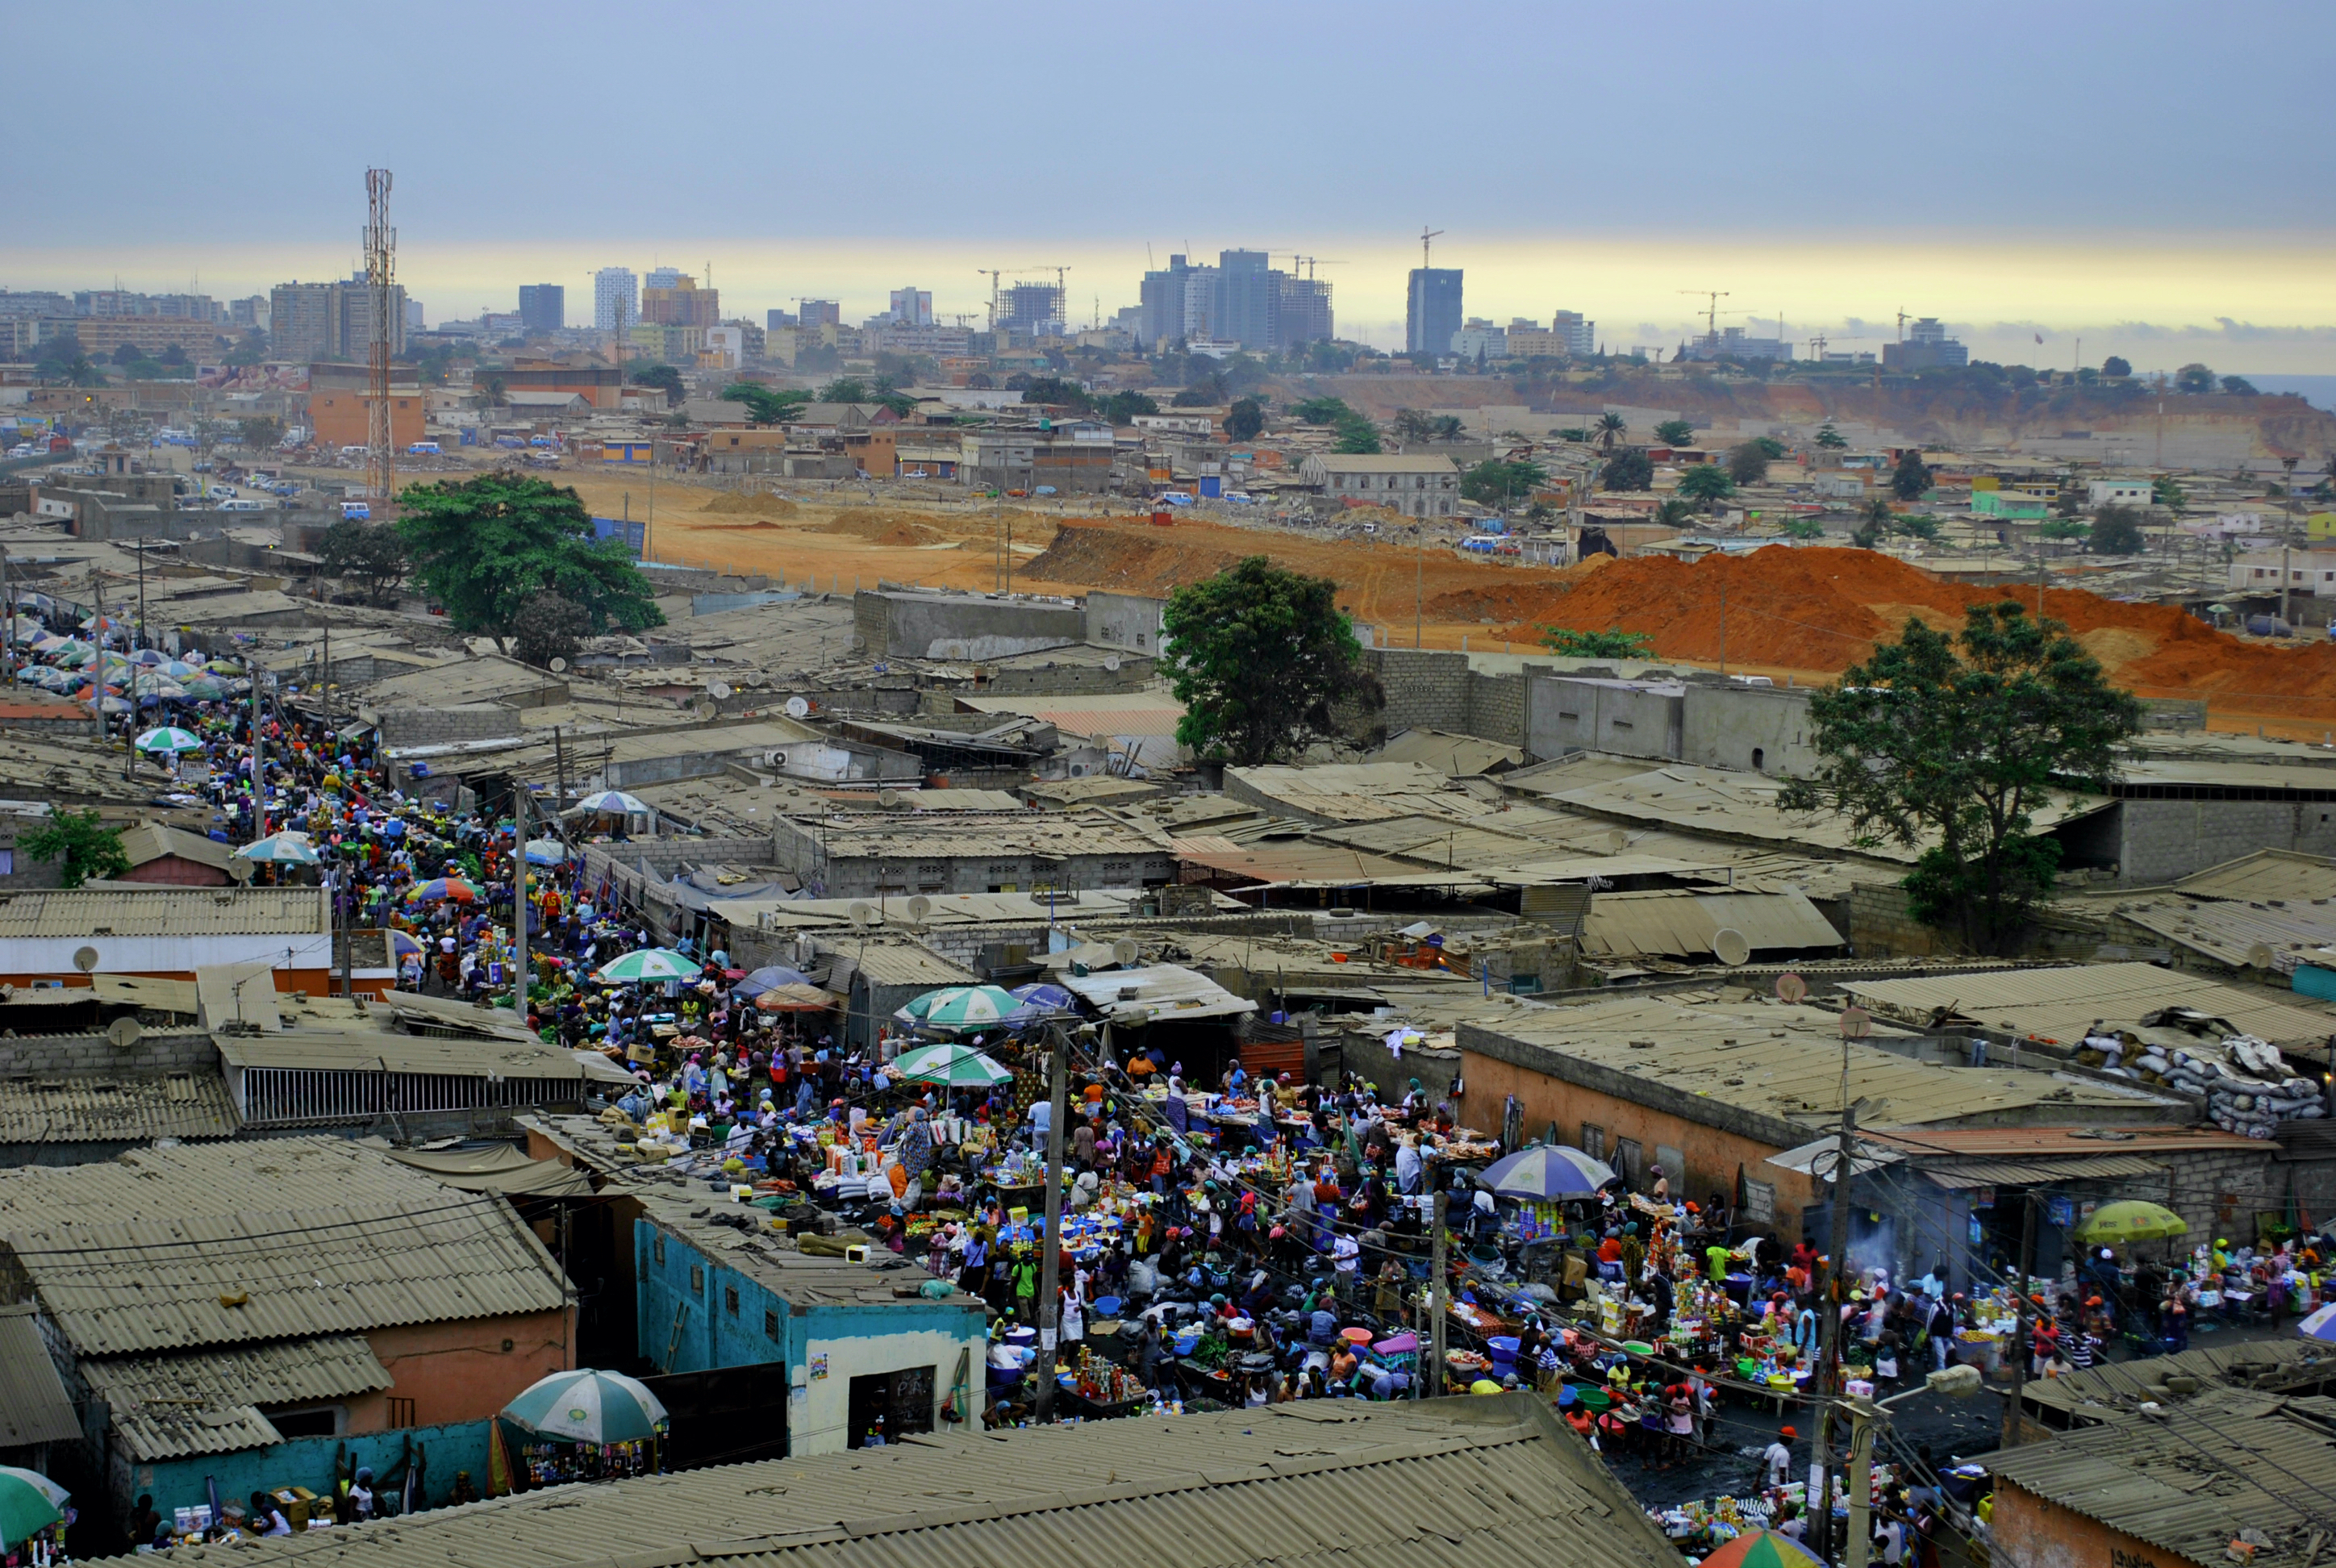
Informal settlement in Angola, Capital city of Luanda.
Courtesy of Adriana Mahdalova via Shutterstock
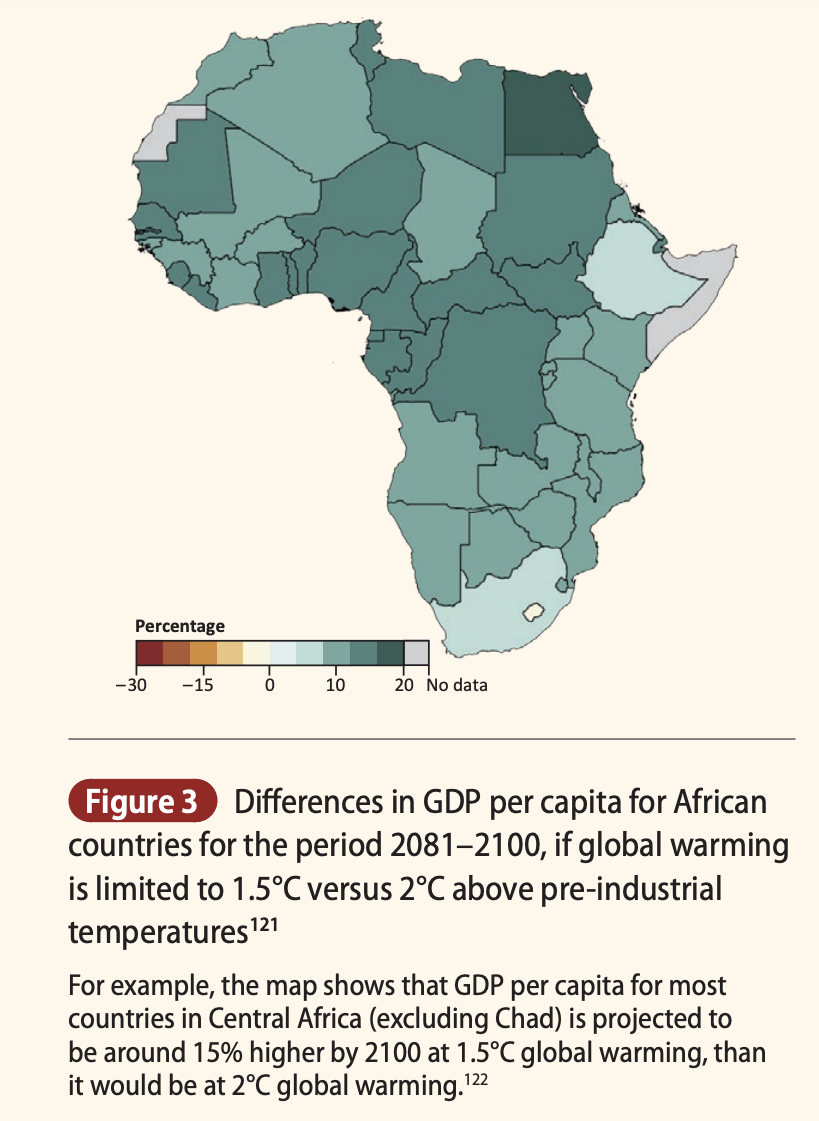
Differences in GDP capita for African countries for the period 2081-2100, if global warming is limited to 1.5°C versus 2°C above pre-industrial temperatures
Courtesy of CDKN
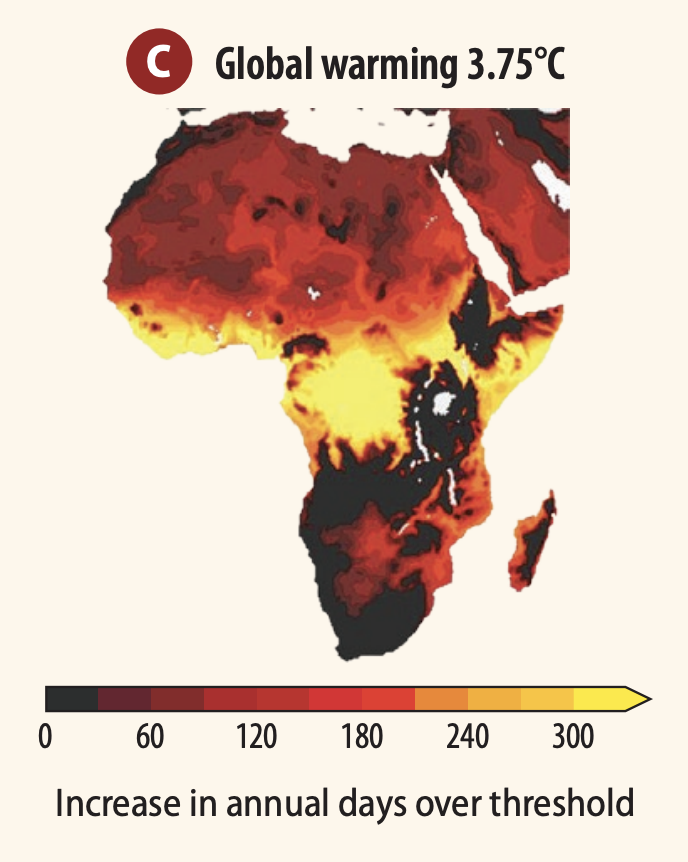
Increase in the number of days per year with severe heat stress for global warming of 3.75°C above pre-industrial levels (1850–2100).
Courtesy of CDKN
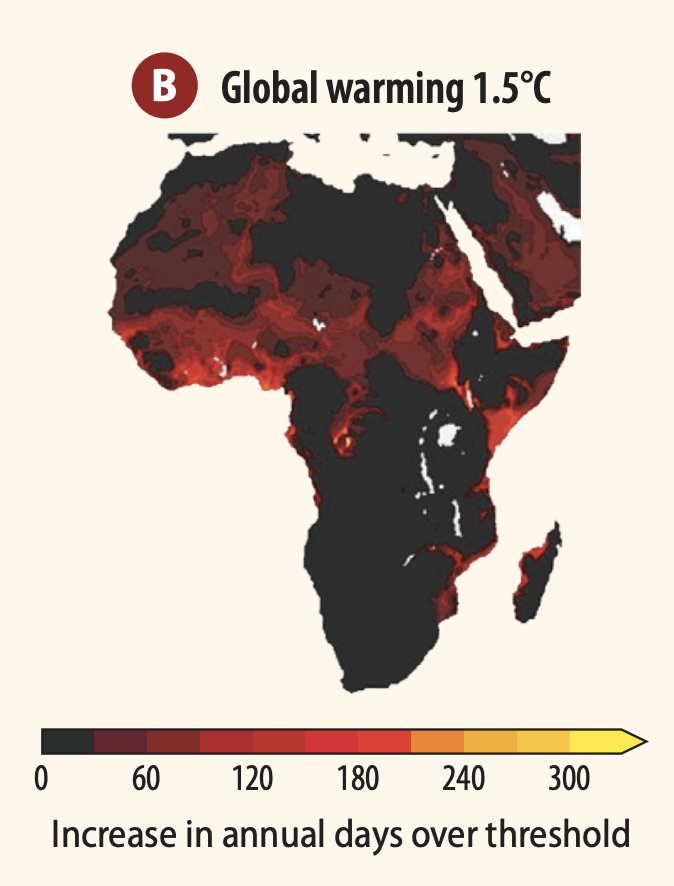
Increase in the number of days per year with severe heat stress for global warming of 1.5°C above pre-industrial levels (1850–2100)
Courtesy of CDKN
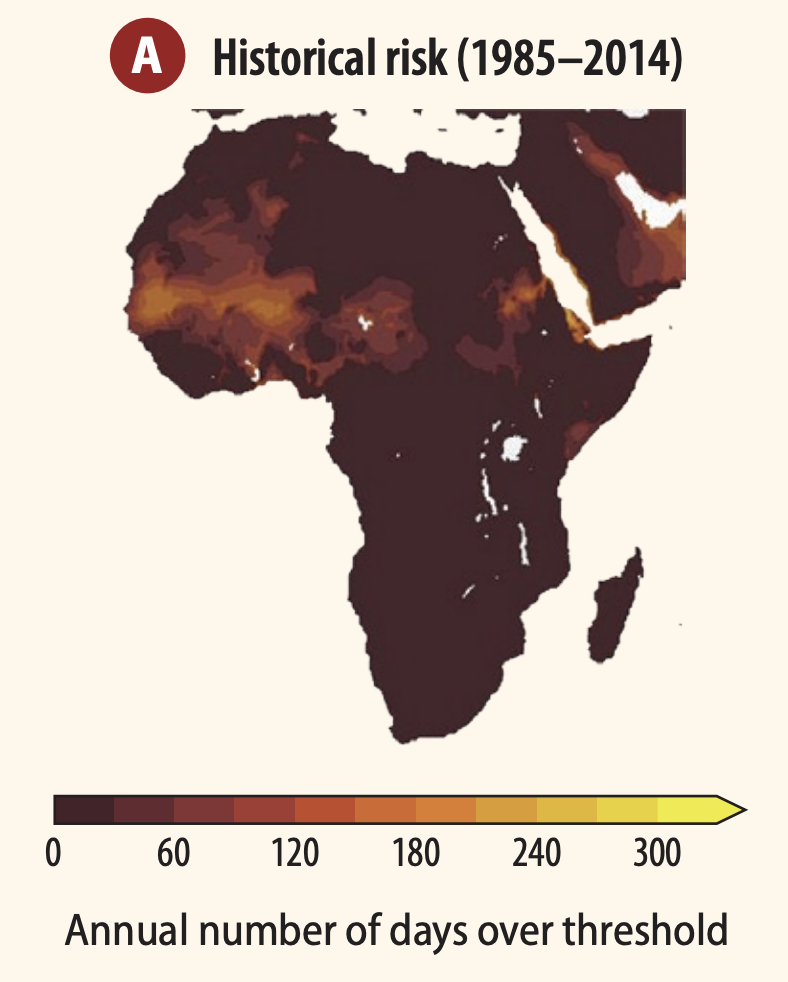
Number of days per year with severe heat stress in the historical climate (1985–2014)
Courtesy of CDKN