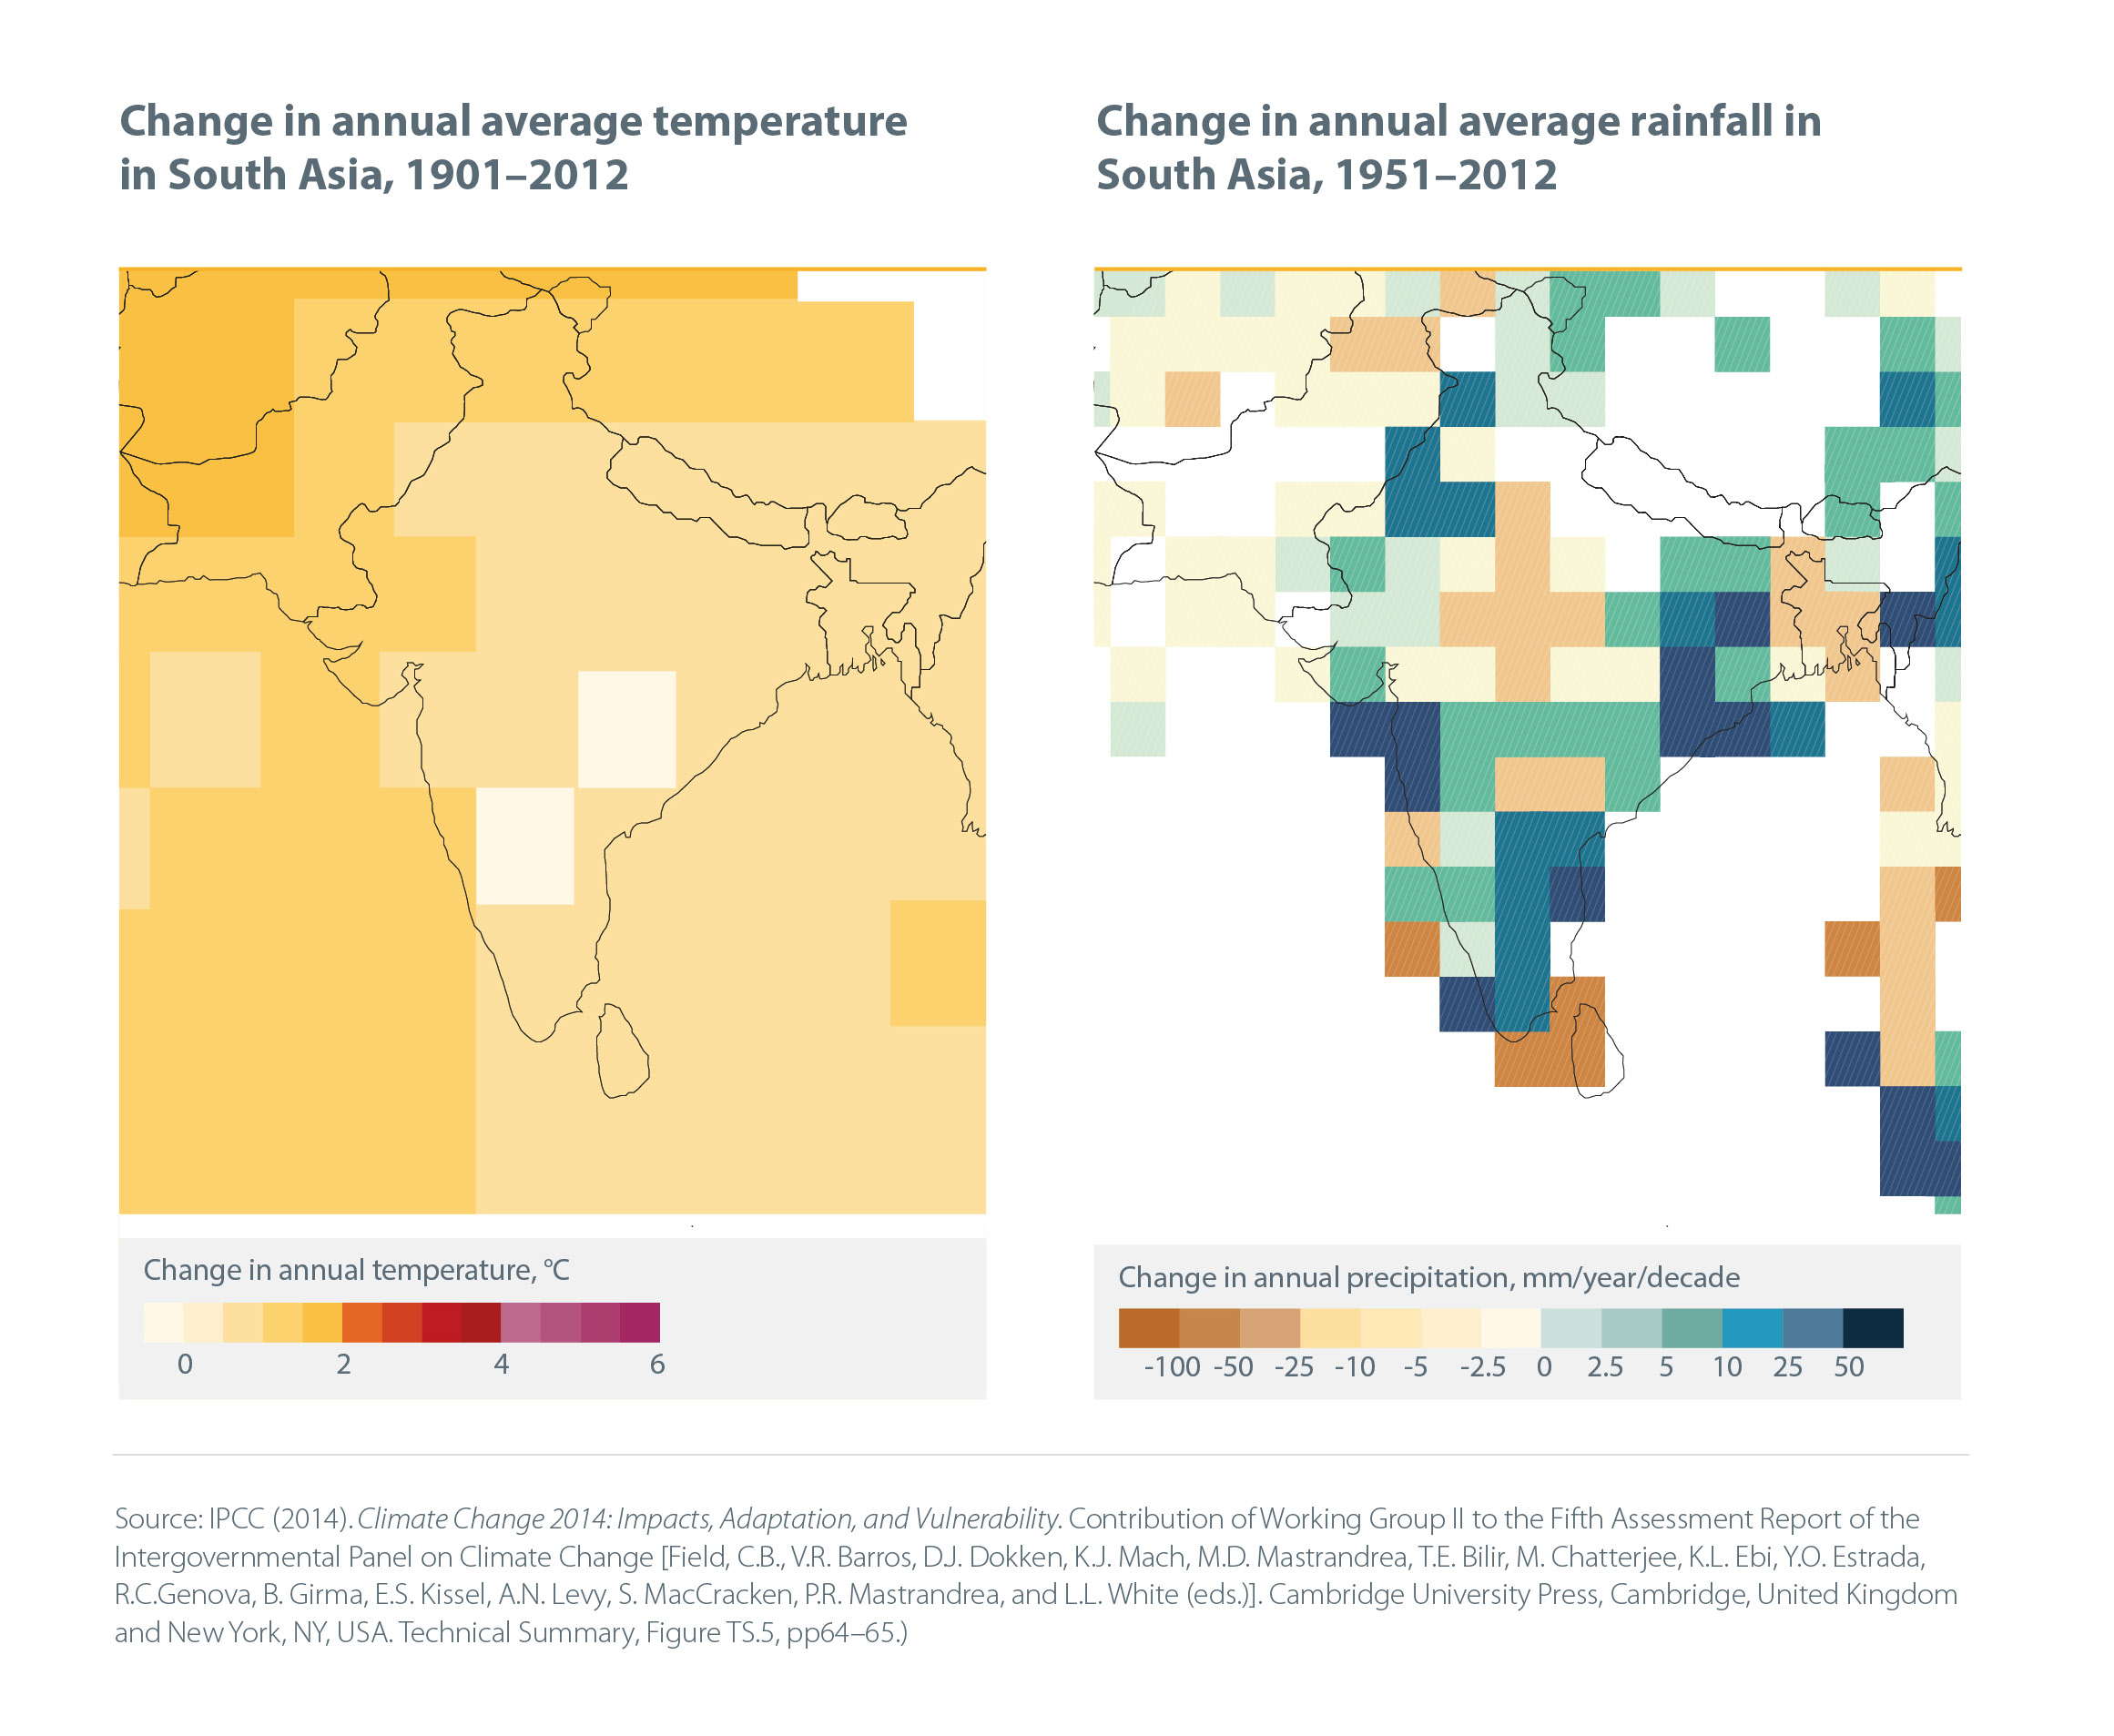
Observed temperature and rainfall in South Asia maps
Observed temperature and rainfall in South Asia maps
The IPCC has produced the most comprehensive assessment of climate change ever. The Fifth Assessment Report (AR5), is the work of 830 expert authors from 85 countries and its first three volumes already stretch to 5,000+ pages. Now, the Climate and Development Knowledge Network (CDKN) and the Overseas Development Institute (ODI) have created two succinct guides to the assessment for decision-makers in Africa and South Asia; the following are infographics from What's in it for South Asia and are intended to encourage understanding and discussion of the report worldwide.
These maps of historic temperature and rainfall data for South Asia are ‘zoomed in’ from the IPCC’s original global maps. Please visit here for the original IPCC maps of worldwide temperature and rainfall trends, and full Fifth Assessment Report reference notes.
You might notice that there are white areas on these maps – that’s because not enough temperature and rainfall data was collected in those white areas to show a definite trend.